Risk Statistics
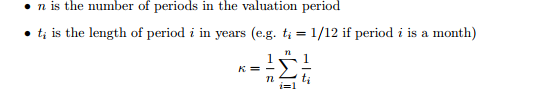
Annualization Factor
Many return and risk statistics are annualized, which often requires an annualization factor. The annualization factor scales the statistics to represent the statistics' values for a single year, and depends on the lengths of the periods in the report. For example, if the report is run for every business day including the holidays in a year that has 260 business days, the annualization factor is K = 260. If the report is run weekly, K = 52, and if the report is run monthly, K = 12. More generally, for custom period, the scaling factor can be calculated as shown below.
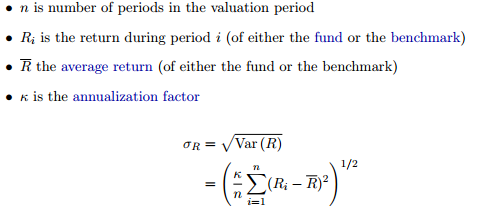
Standard Deviation (Annualized)
Standard deviation is one of the most commonly used measures for the riskiness of a portfolio. Standard deviation measures the variability of the returns over the valuation period and is measured in the same units as the returns themselves. We denote the standard deviation of returns by σR (or alternatively σB to specify the standard deviation of benchmark returns).
Tracking Error (Annualized)
The tracking error measures how much the daily returns of a fund differ from the daily returns of its benchmark. This is a particularly useful measurement for index funds that attempt to mimic their benchmark since the goal is to make the tracking error as small as possible.
![]()
![]()
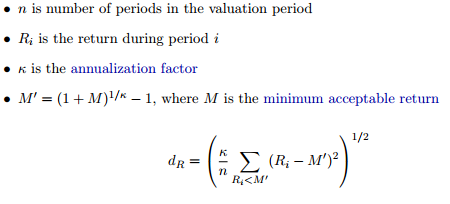
Downside Deviation (Annualized)
Downside deviation measures the downside riskiness of a fund by measuring only downward movements rather than upward and downward movements like standard deviation. To calculate downside deviation, you must first choose a minimum acceptable return, which we will denote M. The default is M = 0.1 (10%).
VaR Ratio
The VaR Ratio (Value at Risk) estimates the maximum loss over a given time horizon with a certain level of confidence. Although there are different ways of calculating VaR, we use the historical method, which aligns best with our ex-post focus.
For our sample calculation, we will use a confidence level of 95% and a time horizon of 1 day. In this situation, the VaR ratio is the maximum loss, by percent, that can be expected for a single day, 95% of the time. Therefore, a loss greater than the VaR can only be expected 5% of the time.
If there are returns for the past 100 days, the VaR would simply be the 5th lowest return over those 100 days. Similarly, if there are 300 days of returns, the VaR would be the 15th lowest return over those 300 days.
When the number of available returns does not divide as nicely by the confidence level (i.e. a confidence level of 95% and available returns for 90 days), we can extrapolate between the necessary returns (i.e. 4th lowest and 5th lowest returns if confidence level is 95% with available returns for 90 days) to find the VaR.
If the time horizon is greater than 1 day (or one period), we can find the VaR for that period by annualizing the VaR found for a single period. For example, if the VaR for 365 days is required, it can be determined by multiplying the VaR for a single day by √ 365 . Similarly, the VaR for 365 days can be determined by multiplying the VaR for a month by √ 12 .
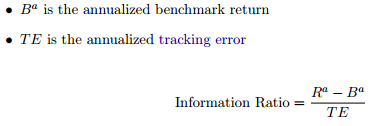
Information Ratio (Annualized)
The information ratio is a risk-adjusted measurement of the active return of a fund over its benchmark.

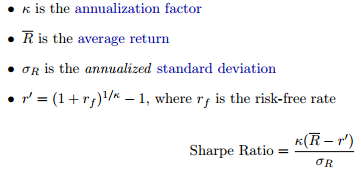
Sharpe Ratio (Annualized)
The Sharpe ratio measures risk-adjusted return. Return here indicates the excess return of the fund to a risk free rate of return. Generally speaking, the greater the Sharpe ratio, the better the risk versus return profile of a fund. In order to calculate the Sharpe ratio, one must choose a risk free rate of return. The default is rf = 0.05 or 5%.
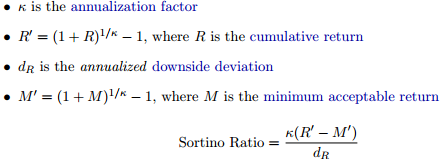
Sortino Ratio (Annualized)
The Sortino ratio is a modification of the Sharpe ratio, where we replace the risk free rate with the minimum acceptable return, which by default is 10%, and replace the standard deviation by downside deviation. This follows the same logic as the use of downside deviation, where we are only concerned with downside risk, not all risk.
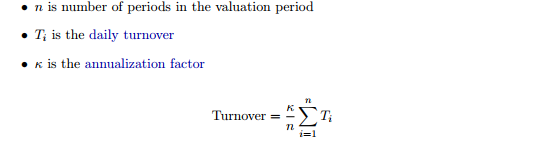
Turnover (Annualized)
Turnover is a measure of how actively managed a fund is, and is reported on an annualized basis. It is given as a percentage that intuitively measures what percentage of the fund’s assets are turned over during a year. For example, a buy and hold strategy has a turnover of zero. A value in the Turnover row only appears in the Fund column. Note also that since Turnover is calculated by looking at changes in share quantity, it cannot be calculated in Value Mode. The fund-level turnover is calculated by annualizing the cumulative daily turnover. The calculation is as follows.
Beta (/Market)
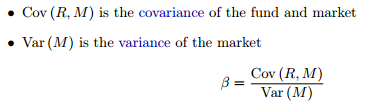
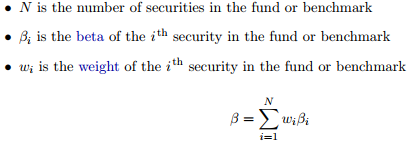
Beta is a measurement of the volatility of a fund compared to the volatility of the market. A beta greater than one means a fund is more volatile with respect to the market, and a beta less than one means a fund is less volatile with respect to the market. The market has a beta one.
We denote beta by β.
The portfolio-level beta is calculated by taking the weighted average of the security-level betas. It is calculated as follows.
Here, we are denoting portfolio-level beta by β.
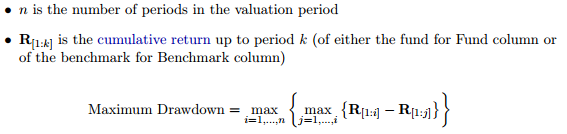
Maximum Drawdown
The maximum drawdown is the greatest drop over any length timespan during the valuation period.
Days/Months in Maximum Drawdown
The number of days/months between the beginning and end of the timespan during which the fund or benchmark was in the maximum drawdown.
Days/Months to Recover
The number of days/months it took the fund or benchmark to return to its value at the beginning of the maximum drawdown. If this value is never reached, the entry is "--".
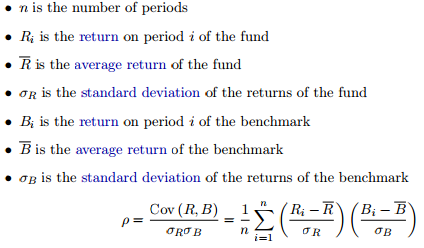
Correlation (/Benchmark)
Correlation measures how related the movements of a fund are with a specific market or benchmark. Correlation is normalized to always be between -1 and 1. A correlation close to 1 indicates the fund and benchmark have similar period-by-period return movements, whereas a correlation close to -1 indicates a the fund and benchmark move in opposite directions. A correlation close to zero indicates there is no linear relationship between movements of the fund and movements of the benchmark.
We define correlation of the fund with its benchmark by ρ.
R-Squared (/Benchmark)
The R-Squared value gives another measurement of how related movements of the fund and its benchmark are. Intuitively, R-squared measures how much the variability of the fund is explained by the variability of the benchmark.
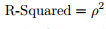
where ρ is the correlation coefficient.