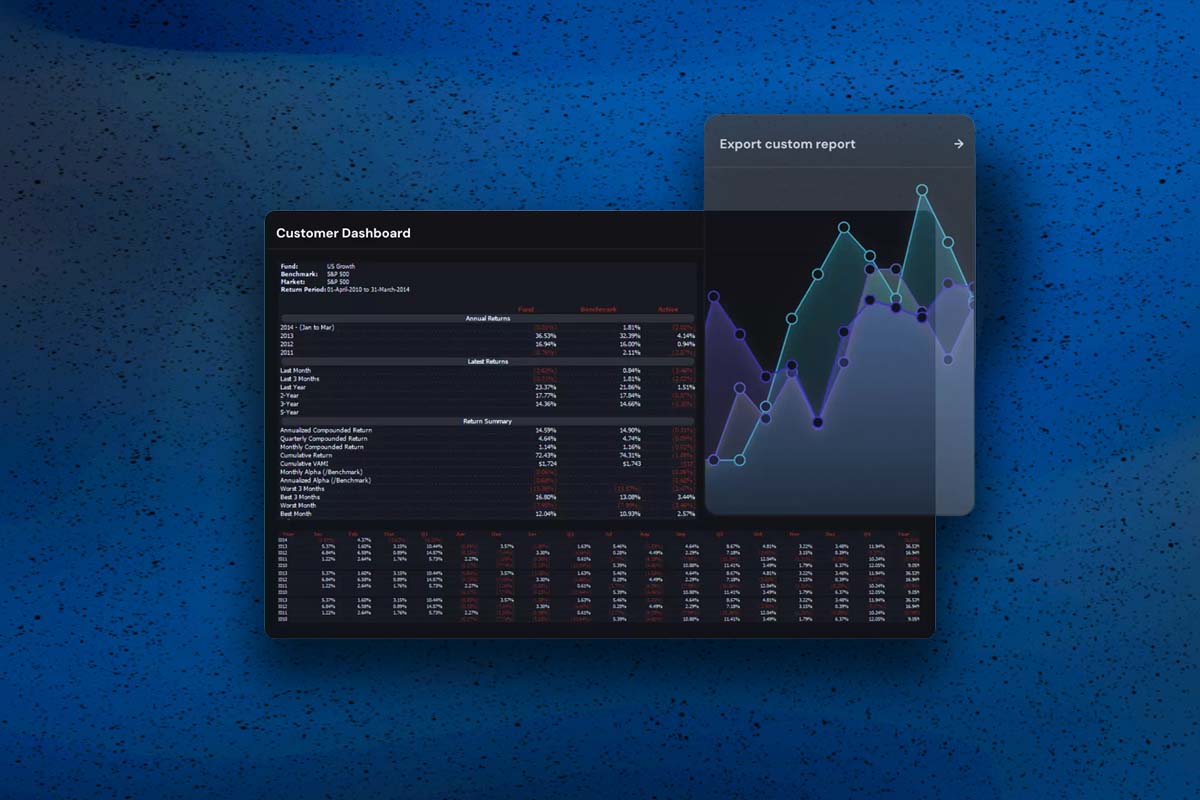
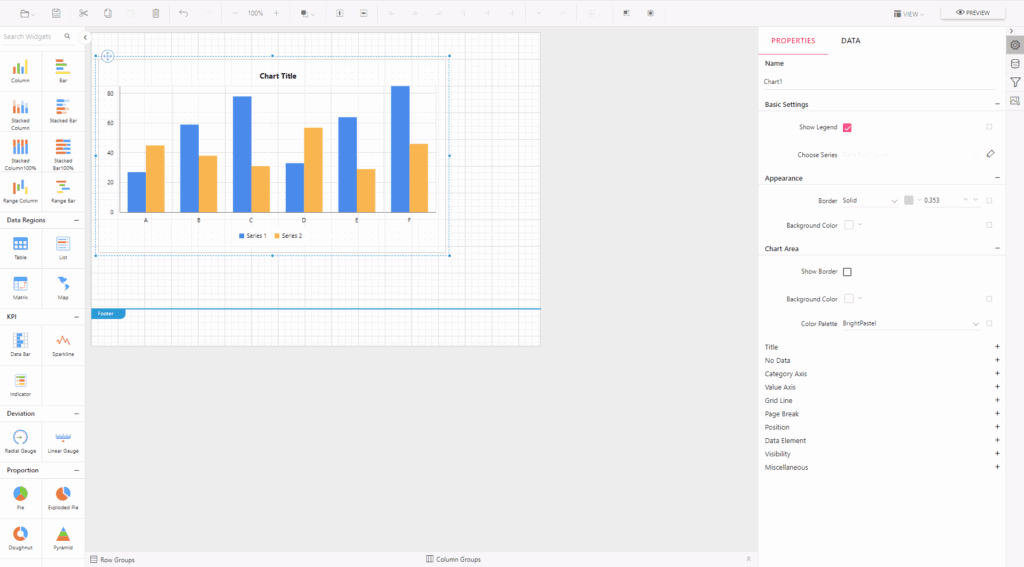
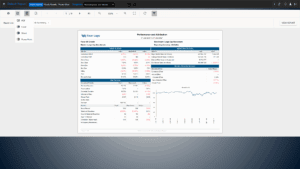
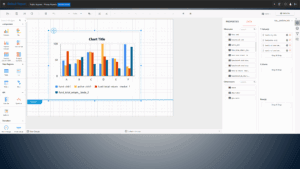
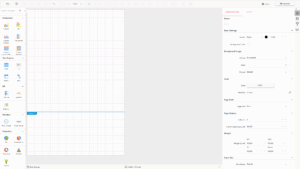
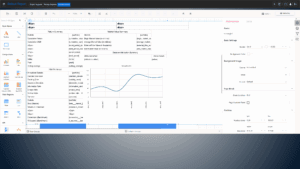
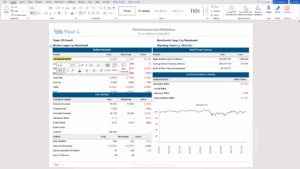
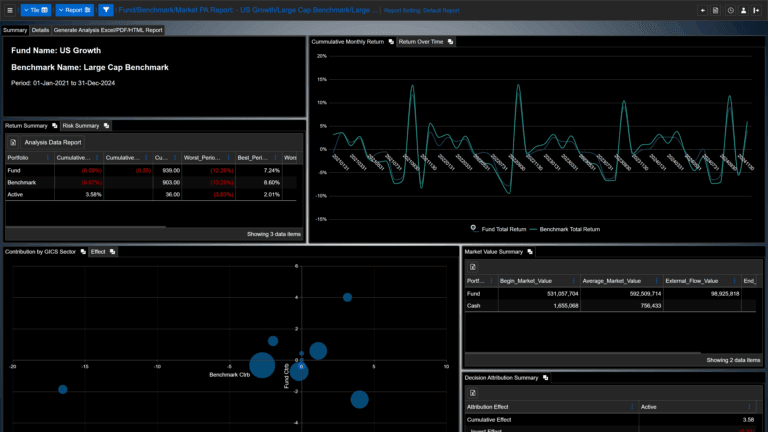
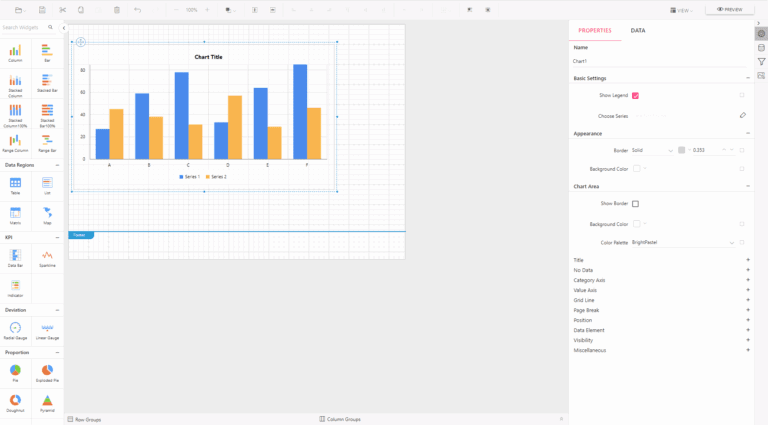
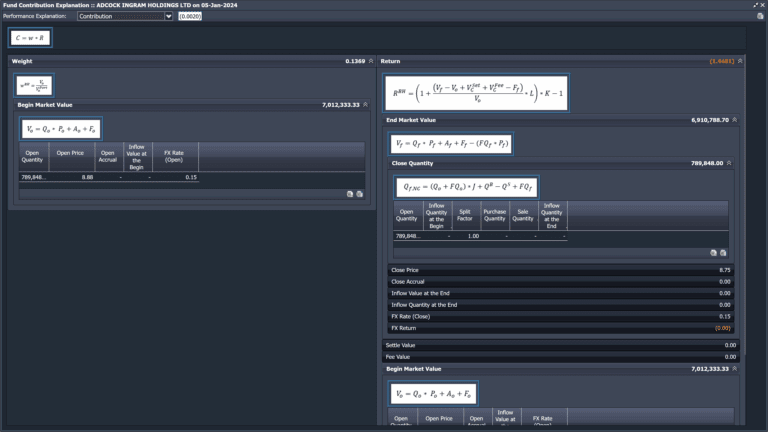
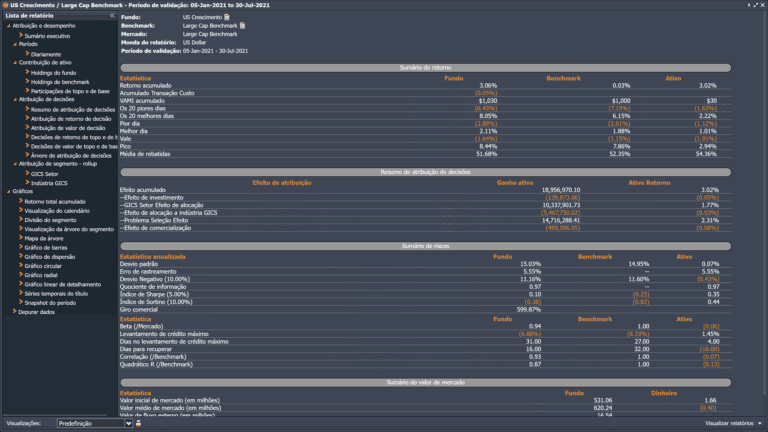
Create stunning reports with no IT skill needed using the powerful, interactive Report Designer. Pull metrics and visualize KPIs, building custom reports with no coding effort. The user interface allows the report to be edited in the same UI in which it is printed or displayed. Furthermore, you can easily edit a report with a mouse, touchscreen, or keyboard interface.
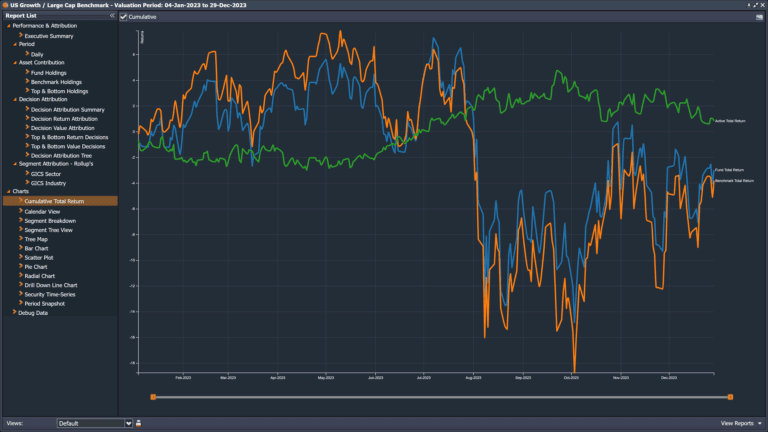
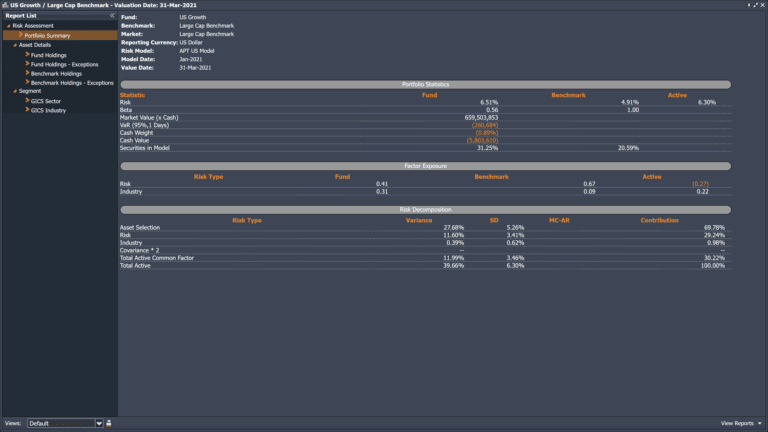
Display data from a data set in cells organized into rows and columns using a table or matrix. Use item-specific features like multiple grouping and sorting, section totals, and repeating headers to make the report more readable. Graphically represent data in a wide array of charts to present it clearly and concisely, supports 20+ commonly used chart types (column, line, shape, area, bar, range, scatter, polar, and more)
Users can interact with paginated reports at runtime to narrow them to specific data. The parameters allow for building dynamic reports. Users can expand or collapse report items, rows, and columns associated with a group in a table or matrix. Add hyperlinks to open external web pages in a browser.
Save professional reports in the most commonly used file formats and share them with analysts and users so they can build action plans to meet their business goals. Reports can be white-labeled. It can be easily branded as your own. You can add your own logos and custom themes.
