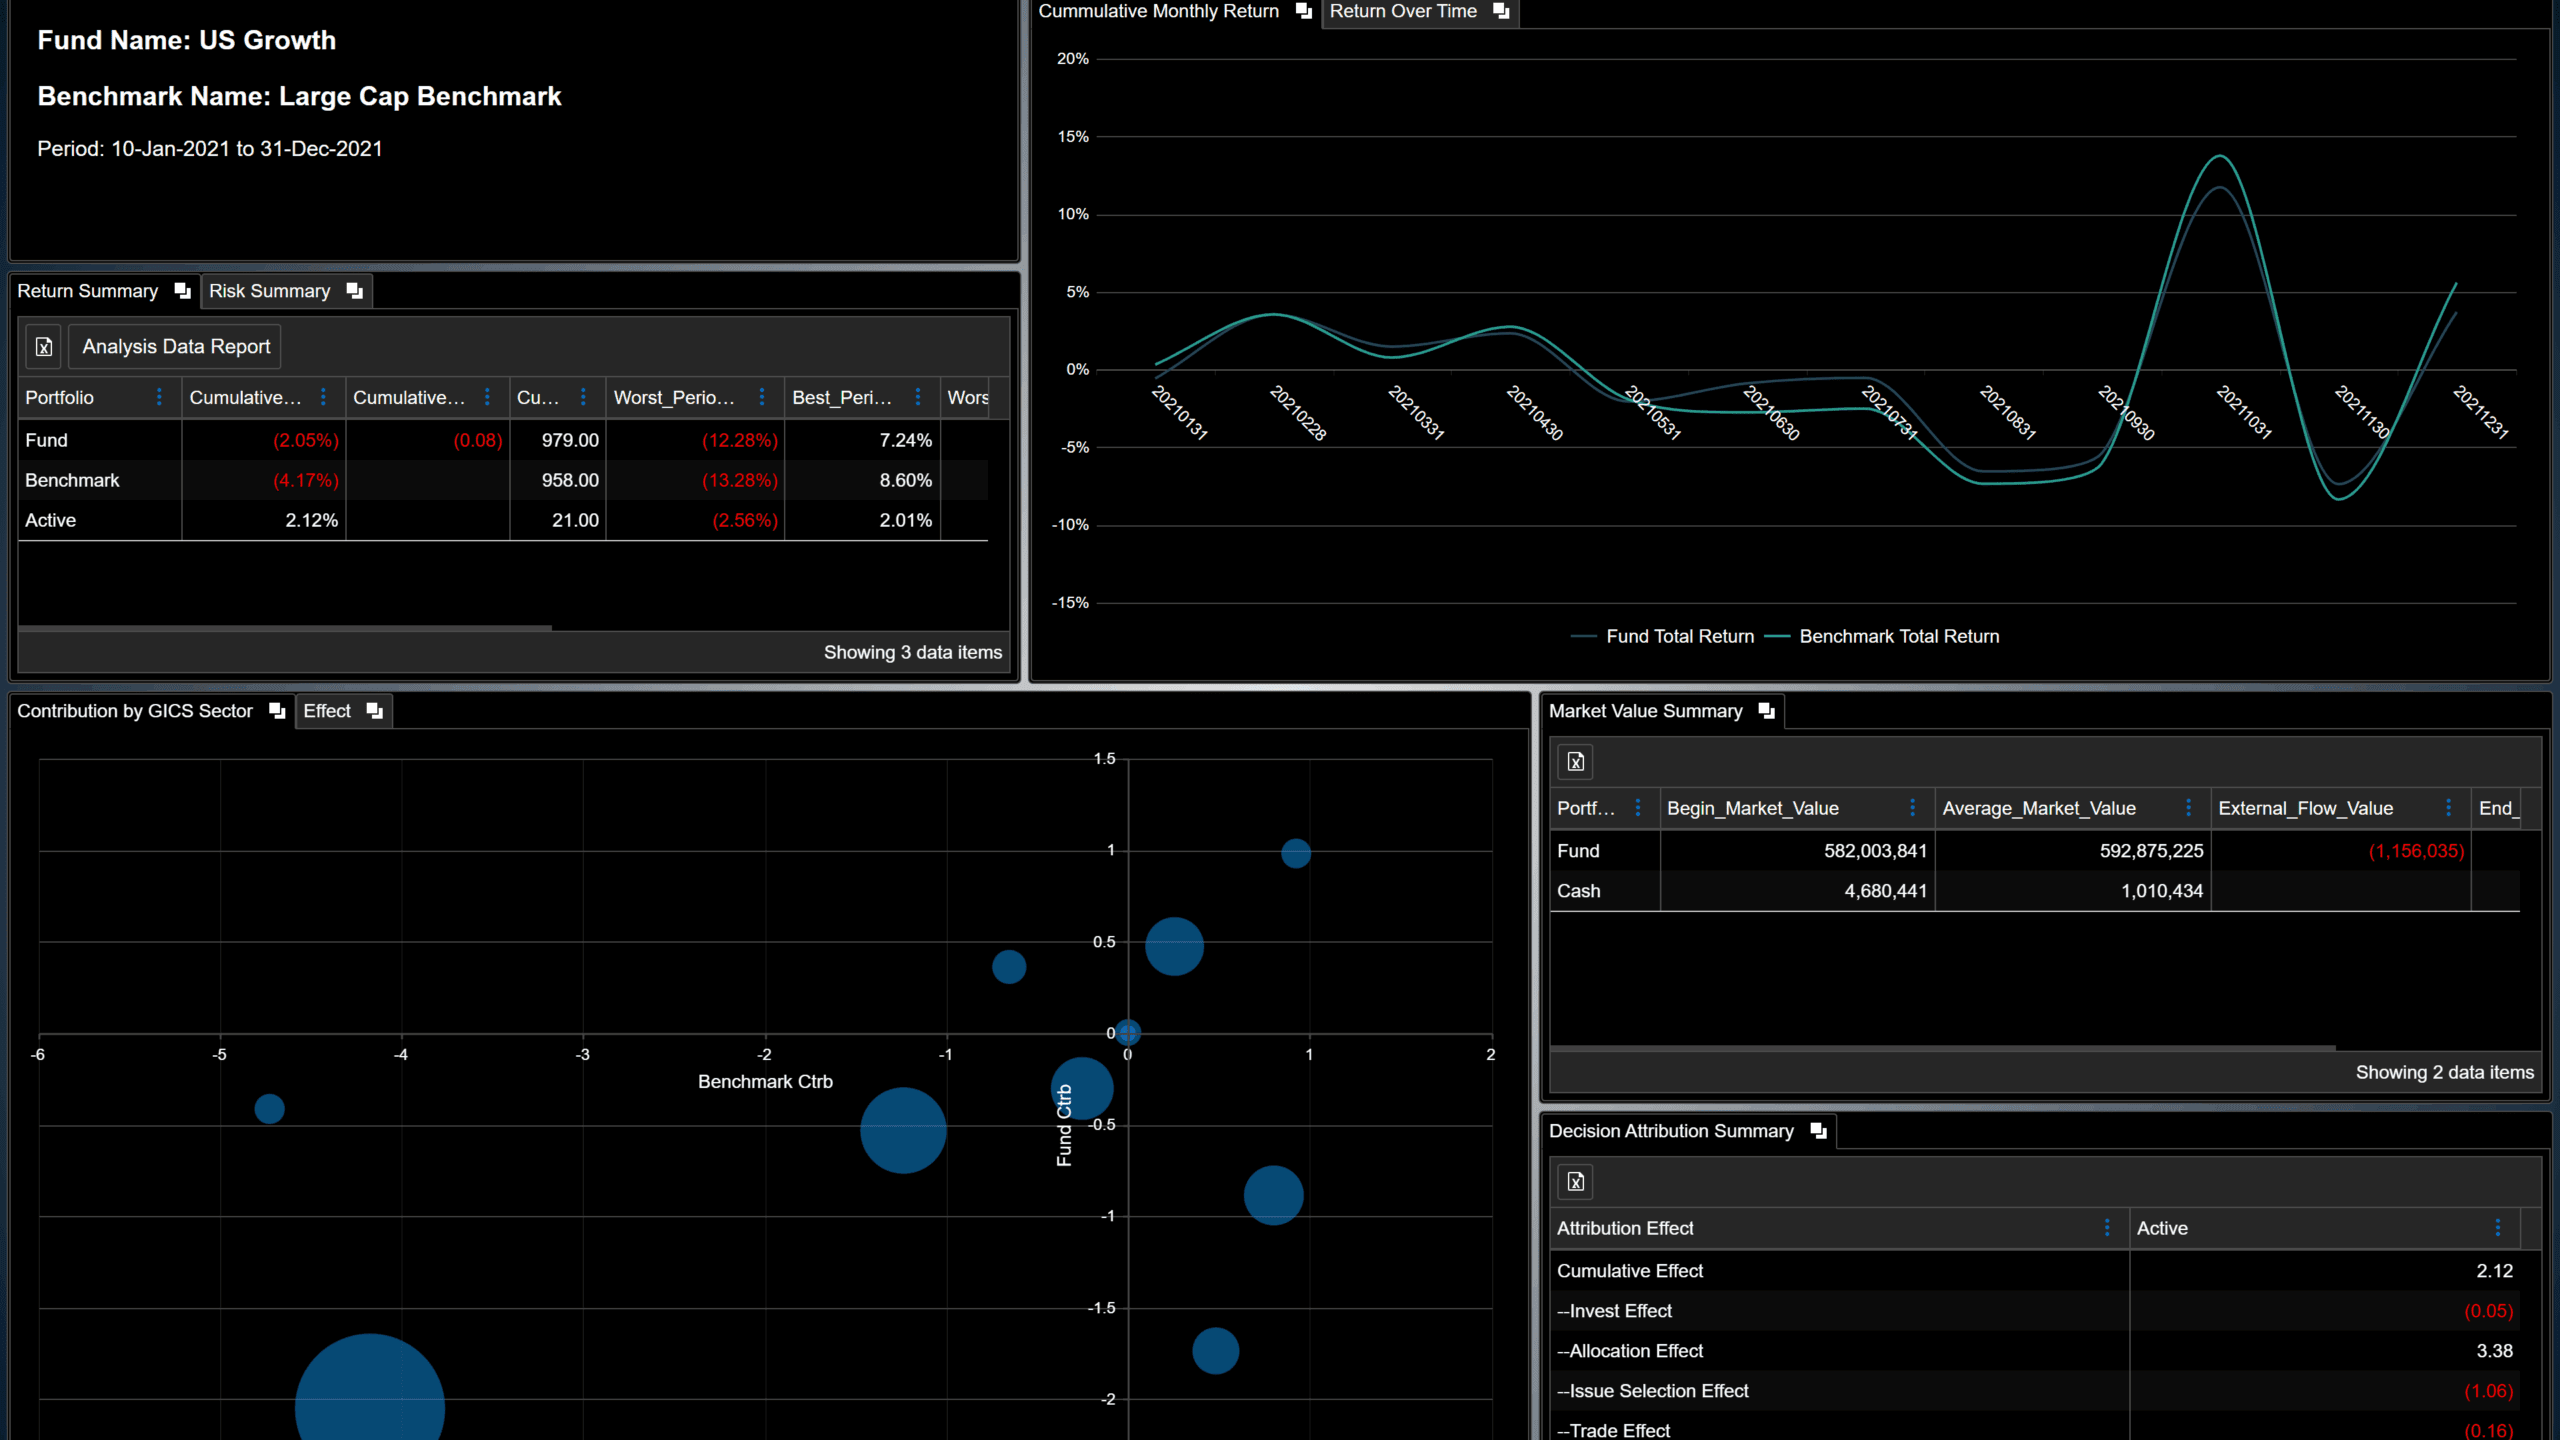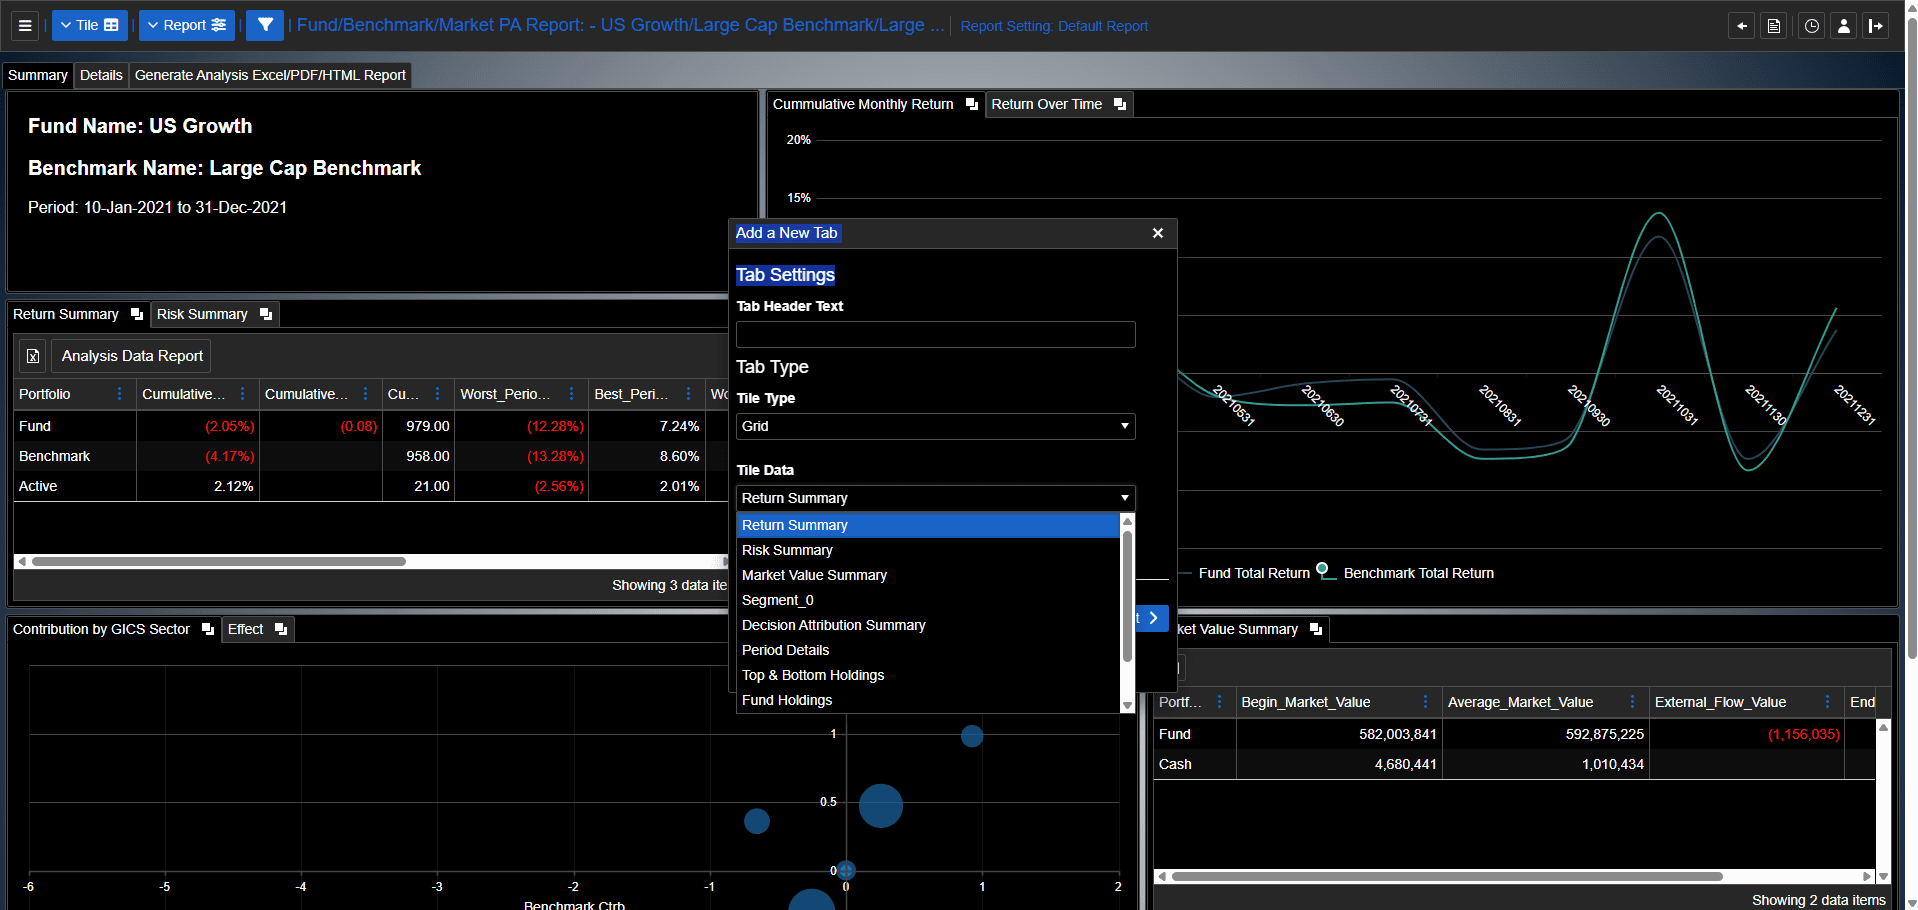
Consolidate visualizations using multiple features.
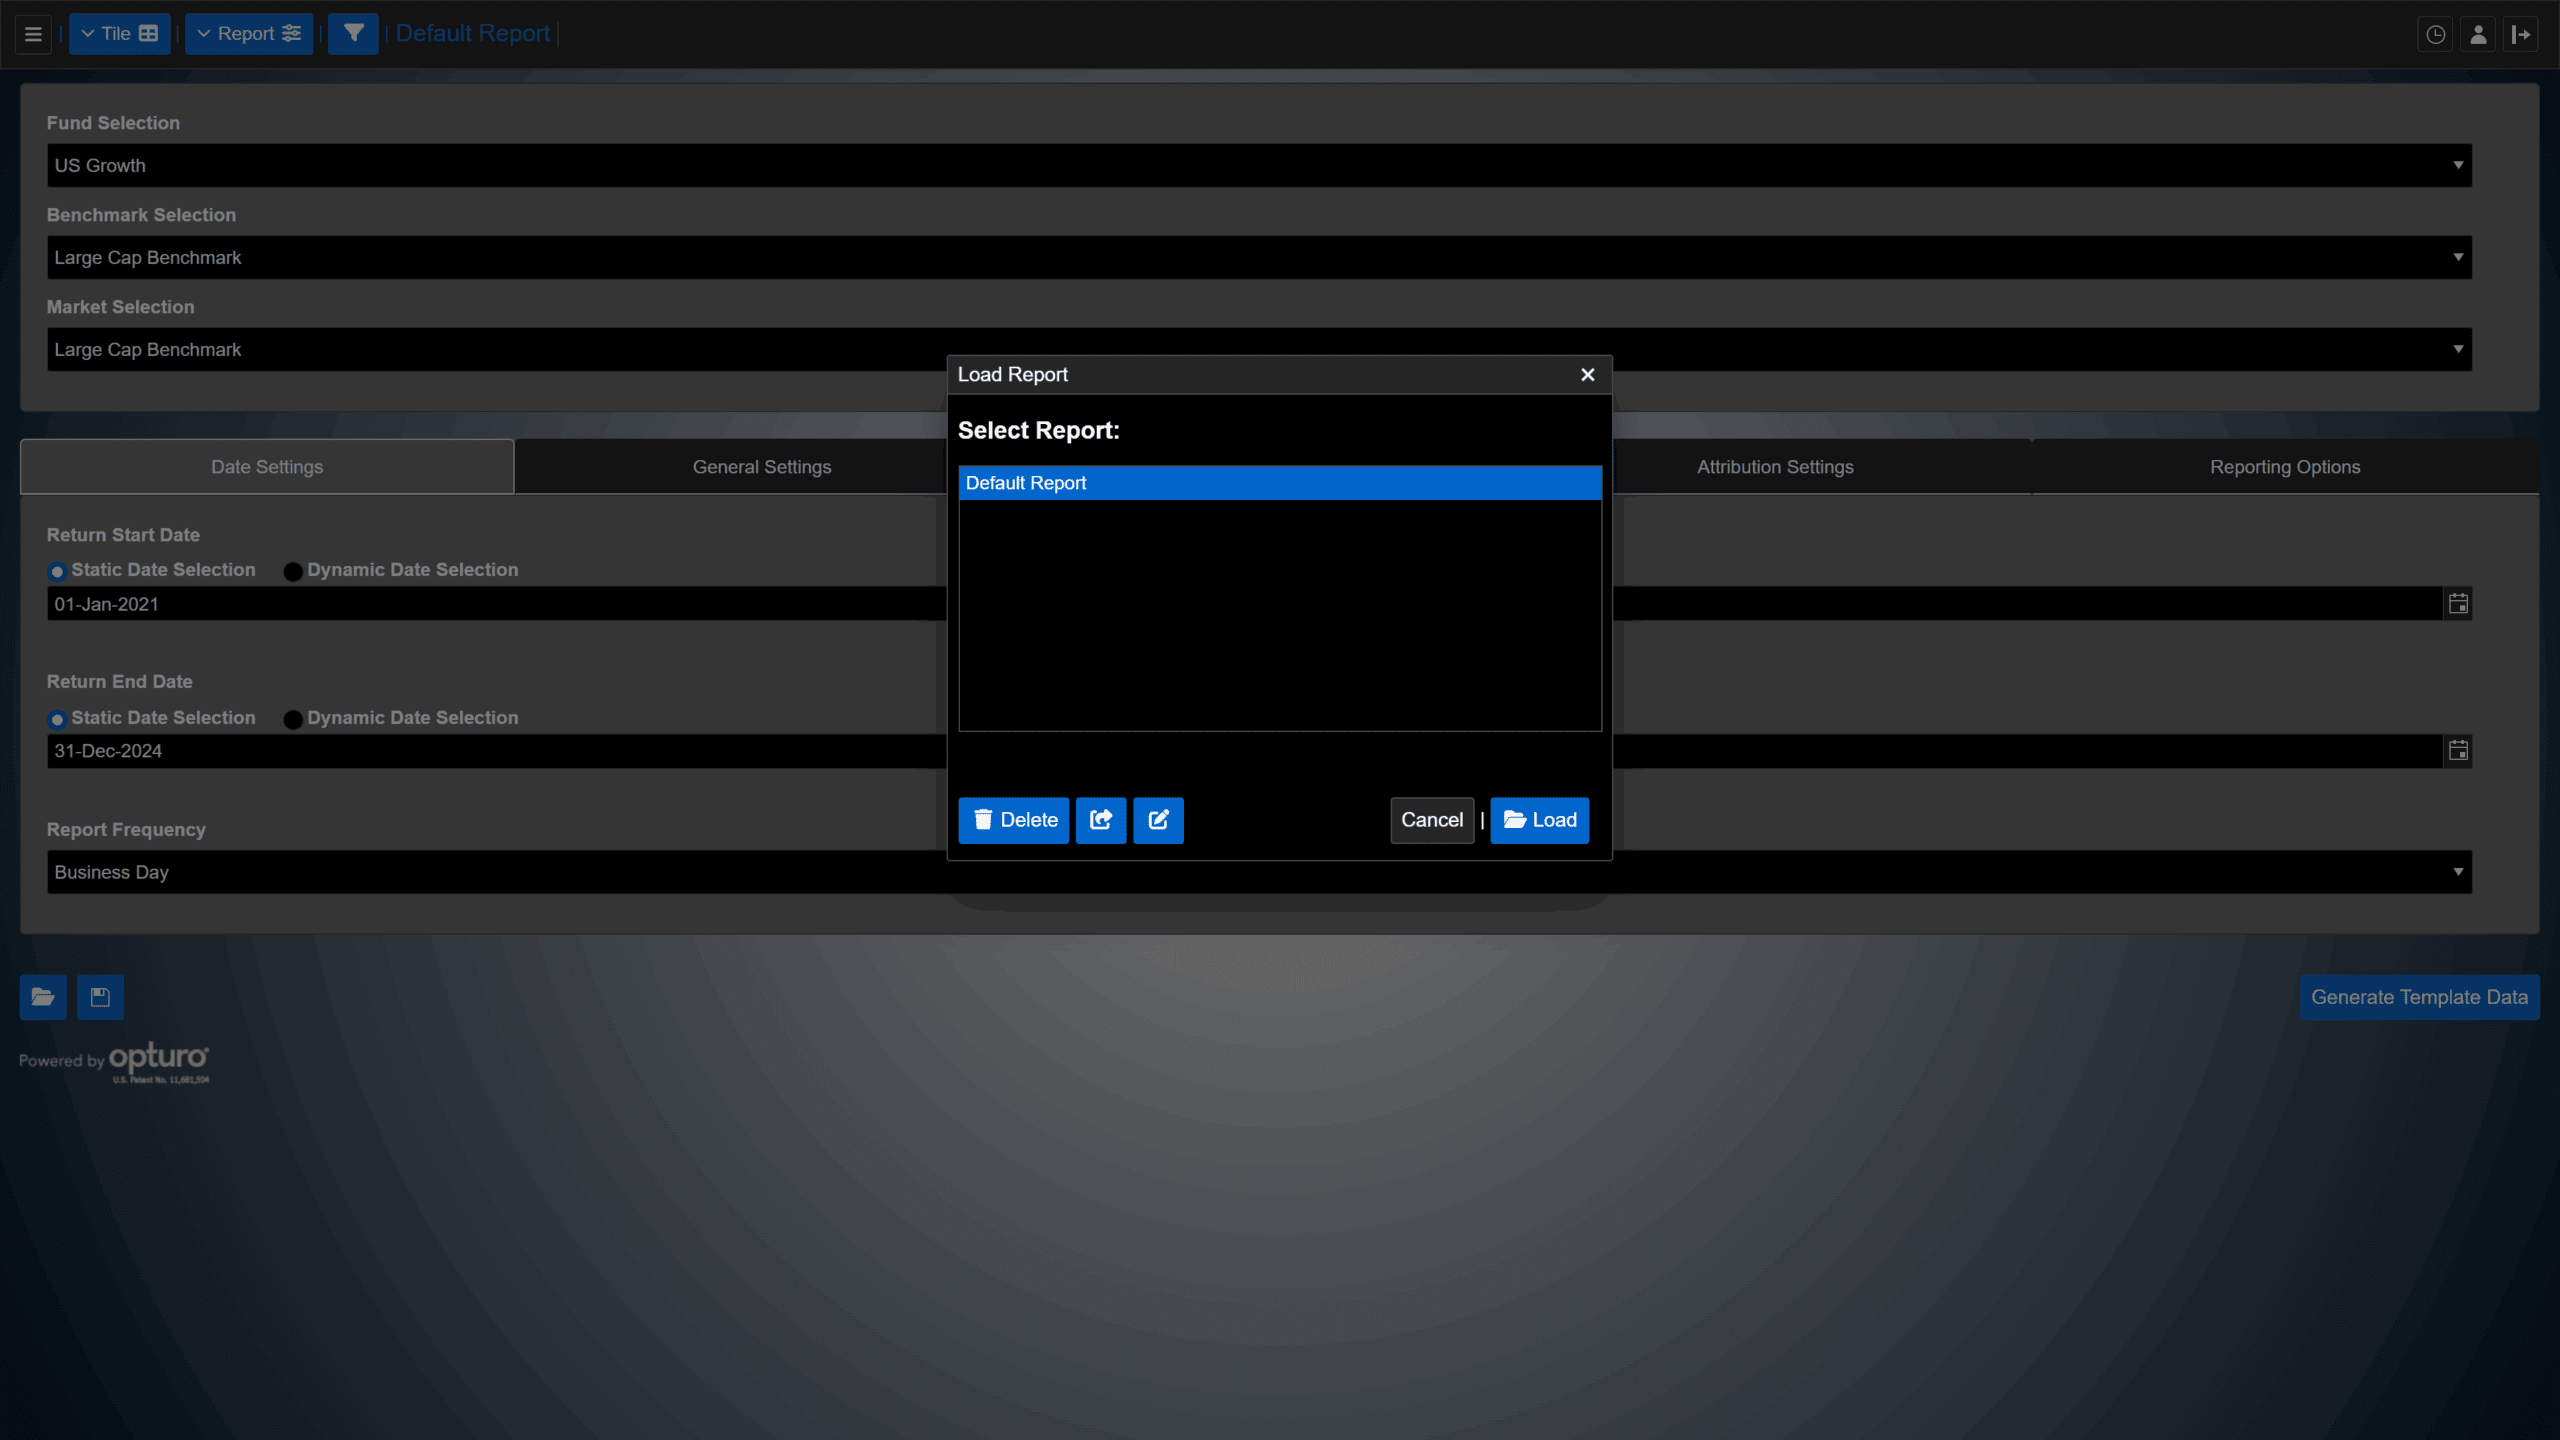
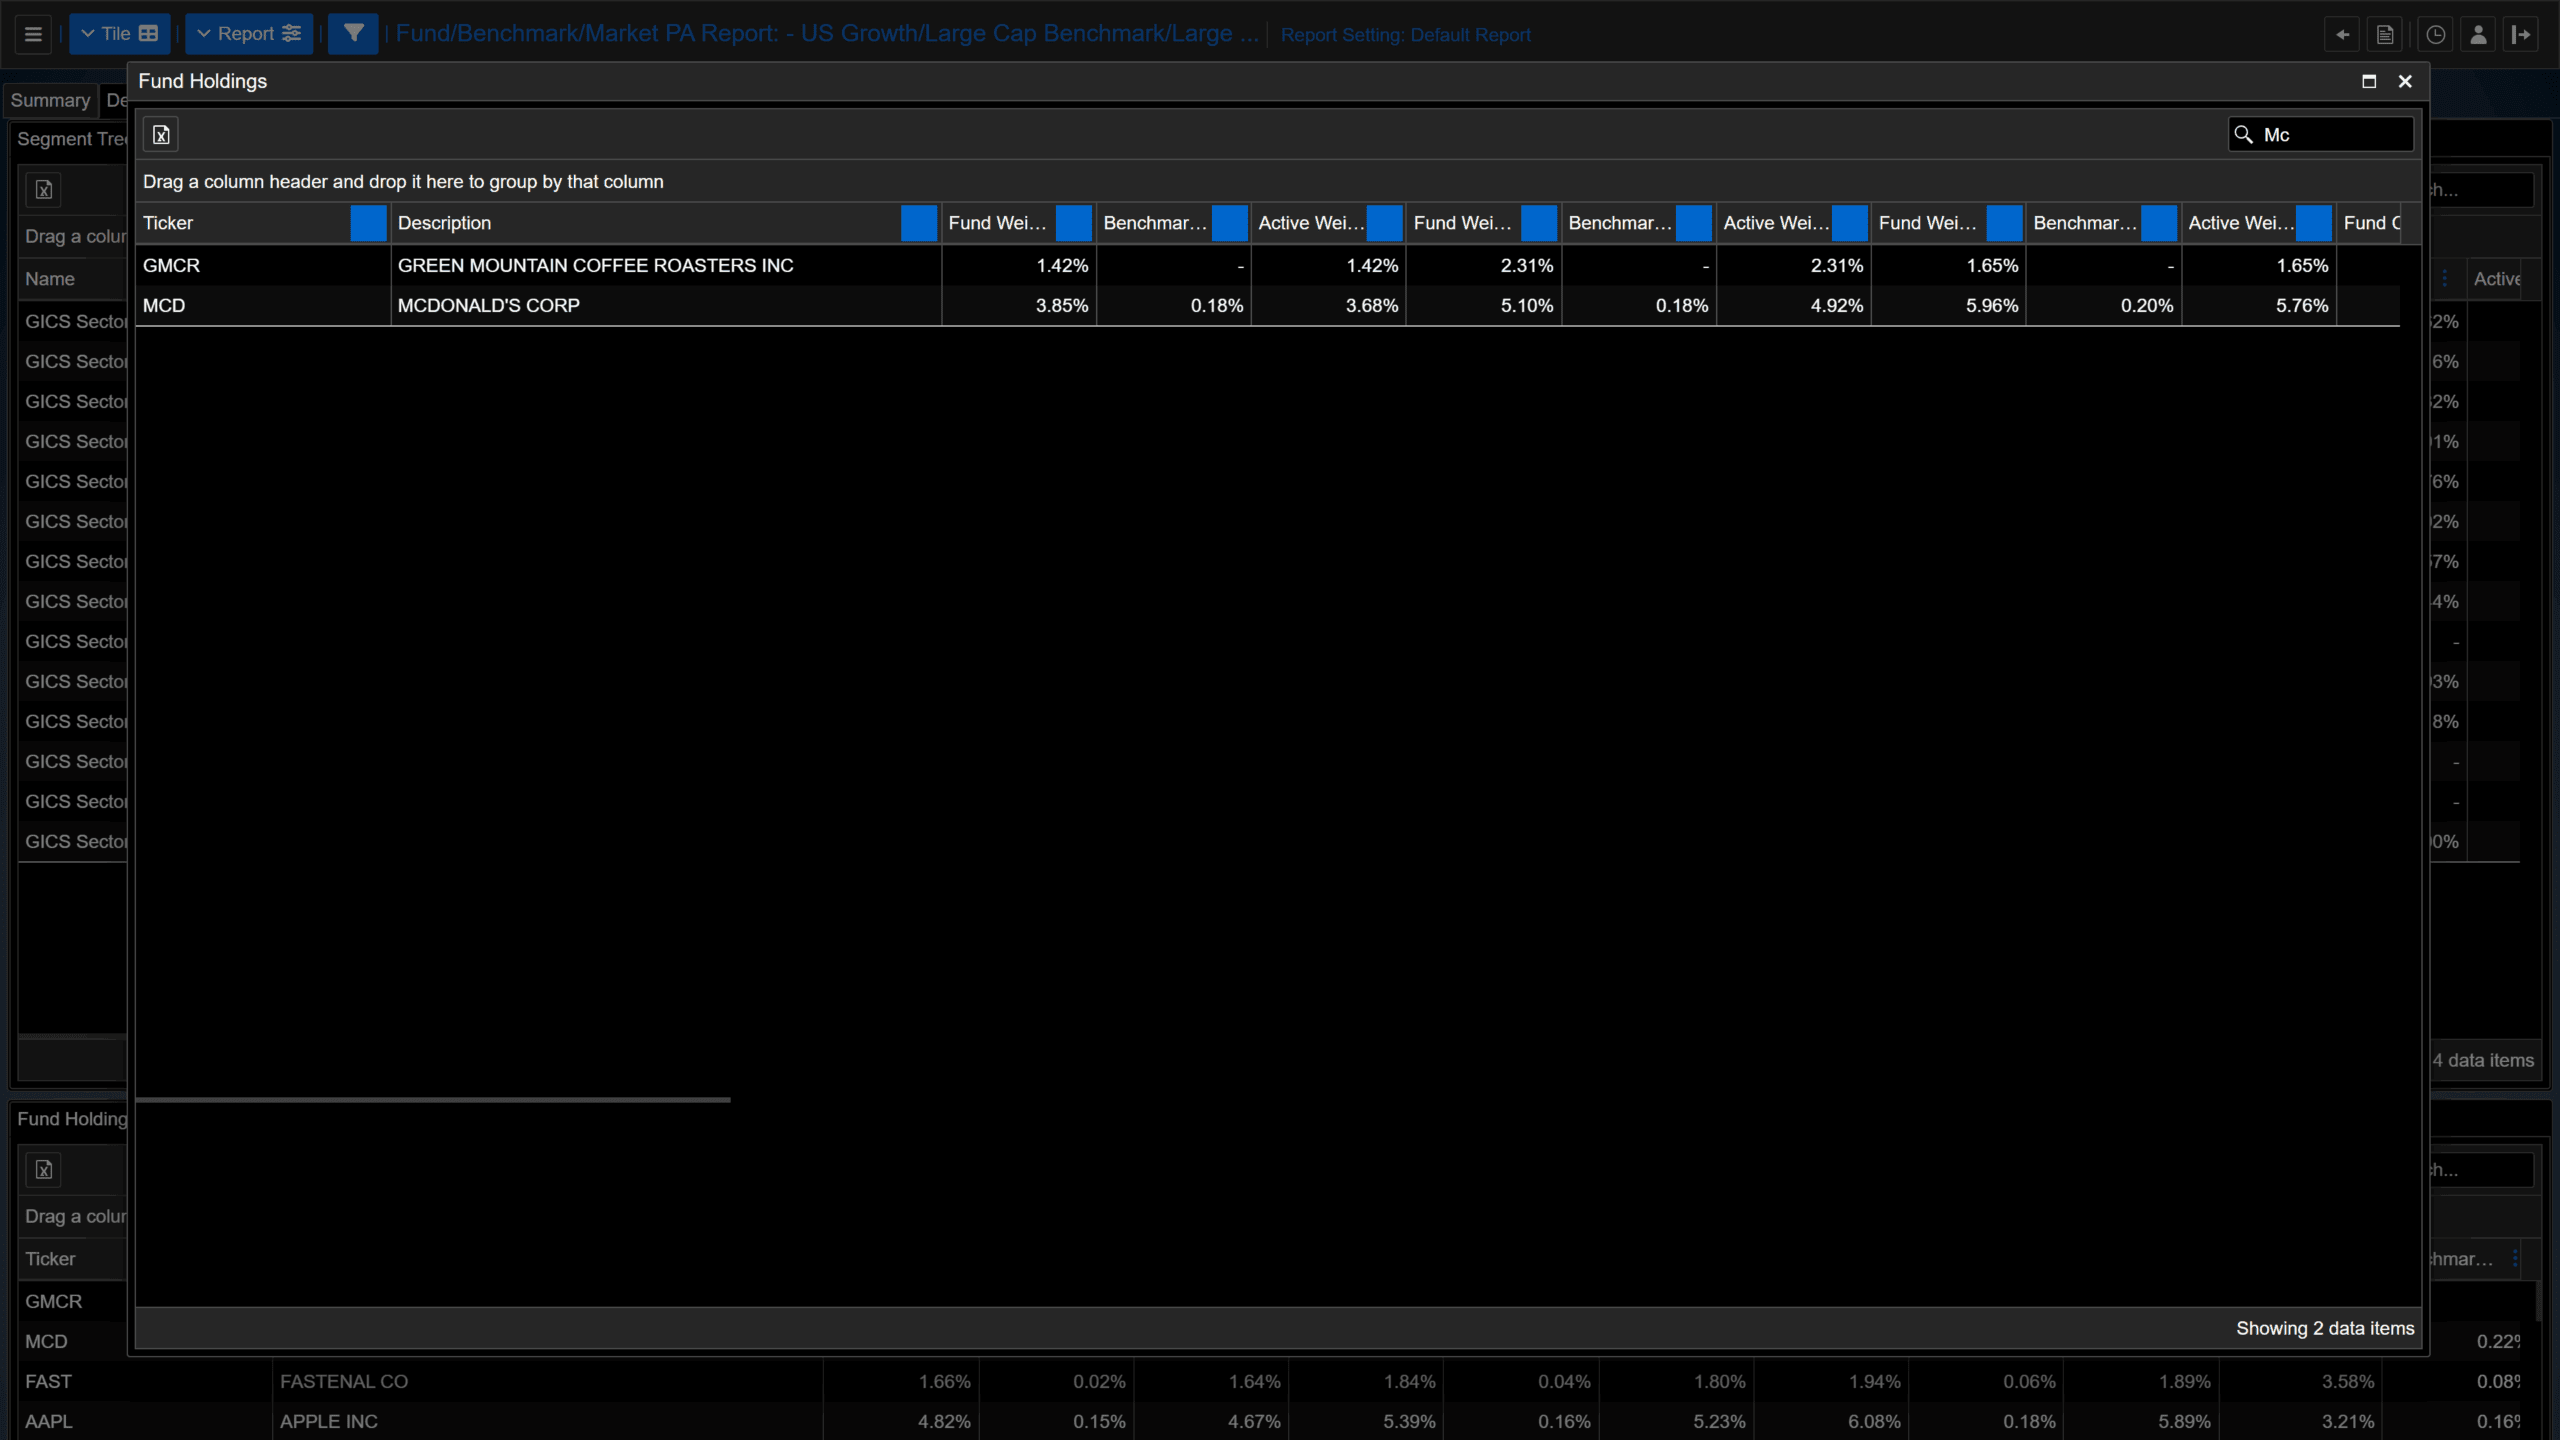
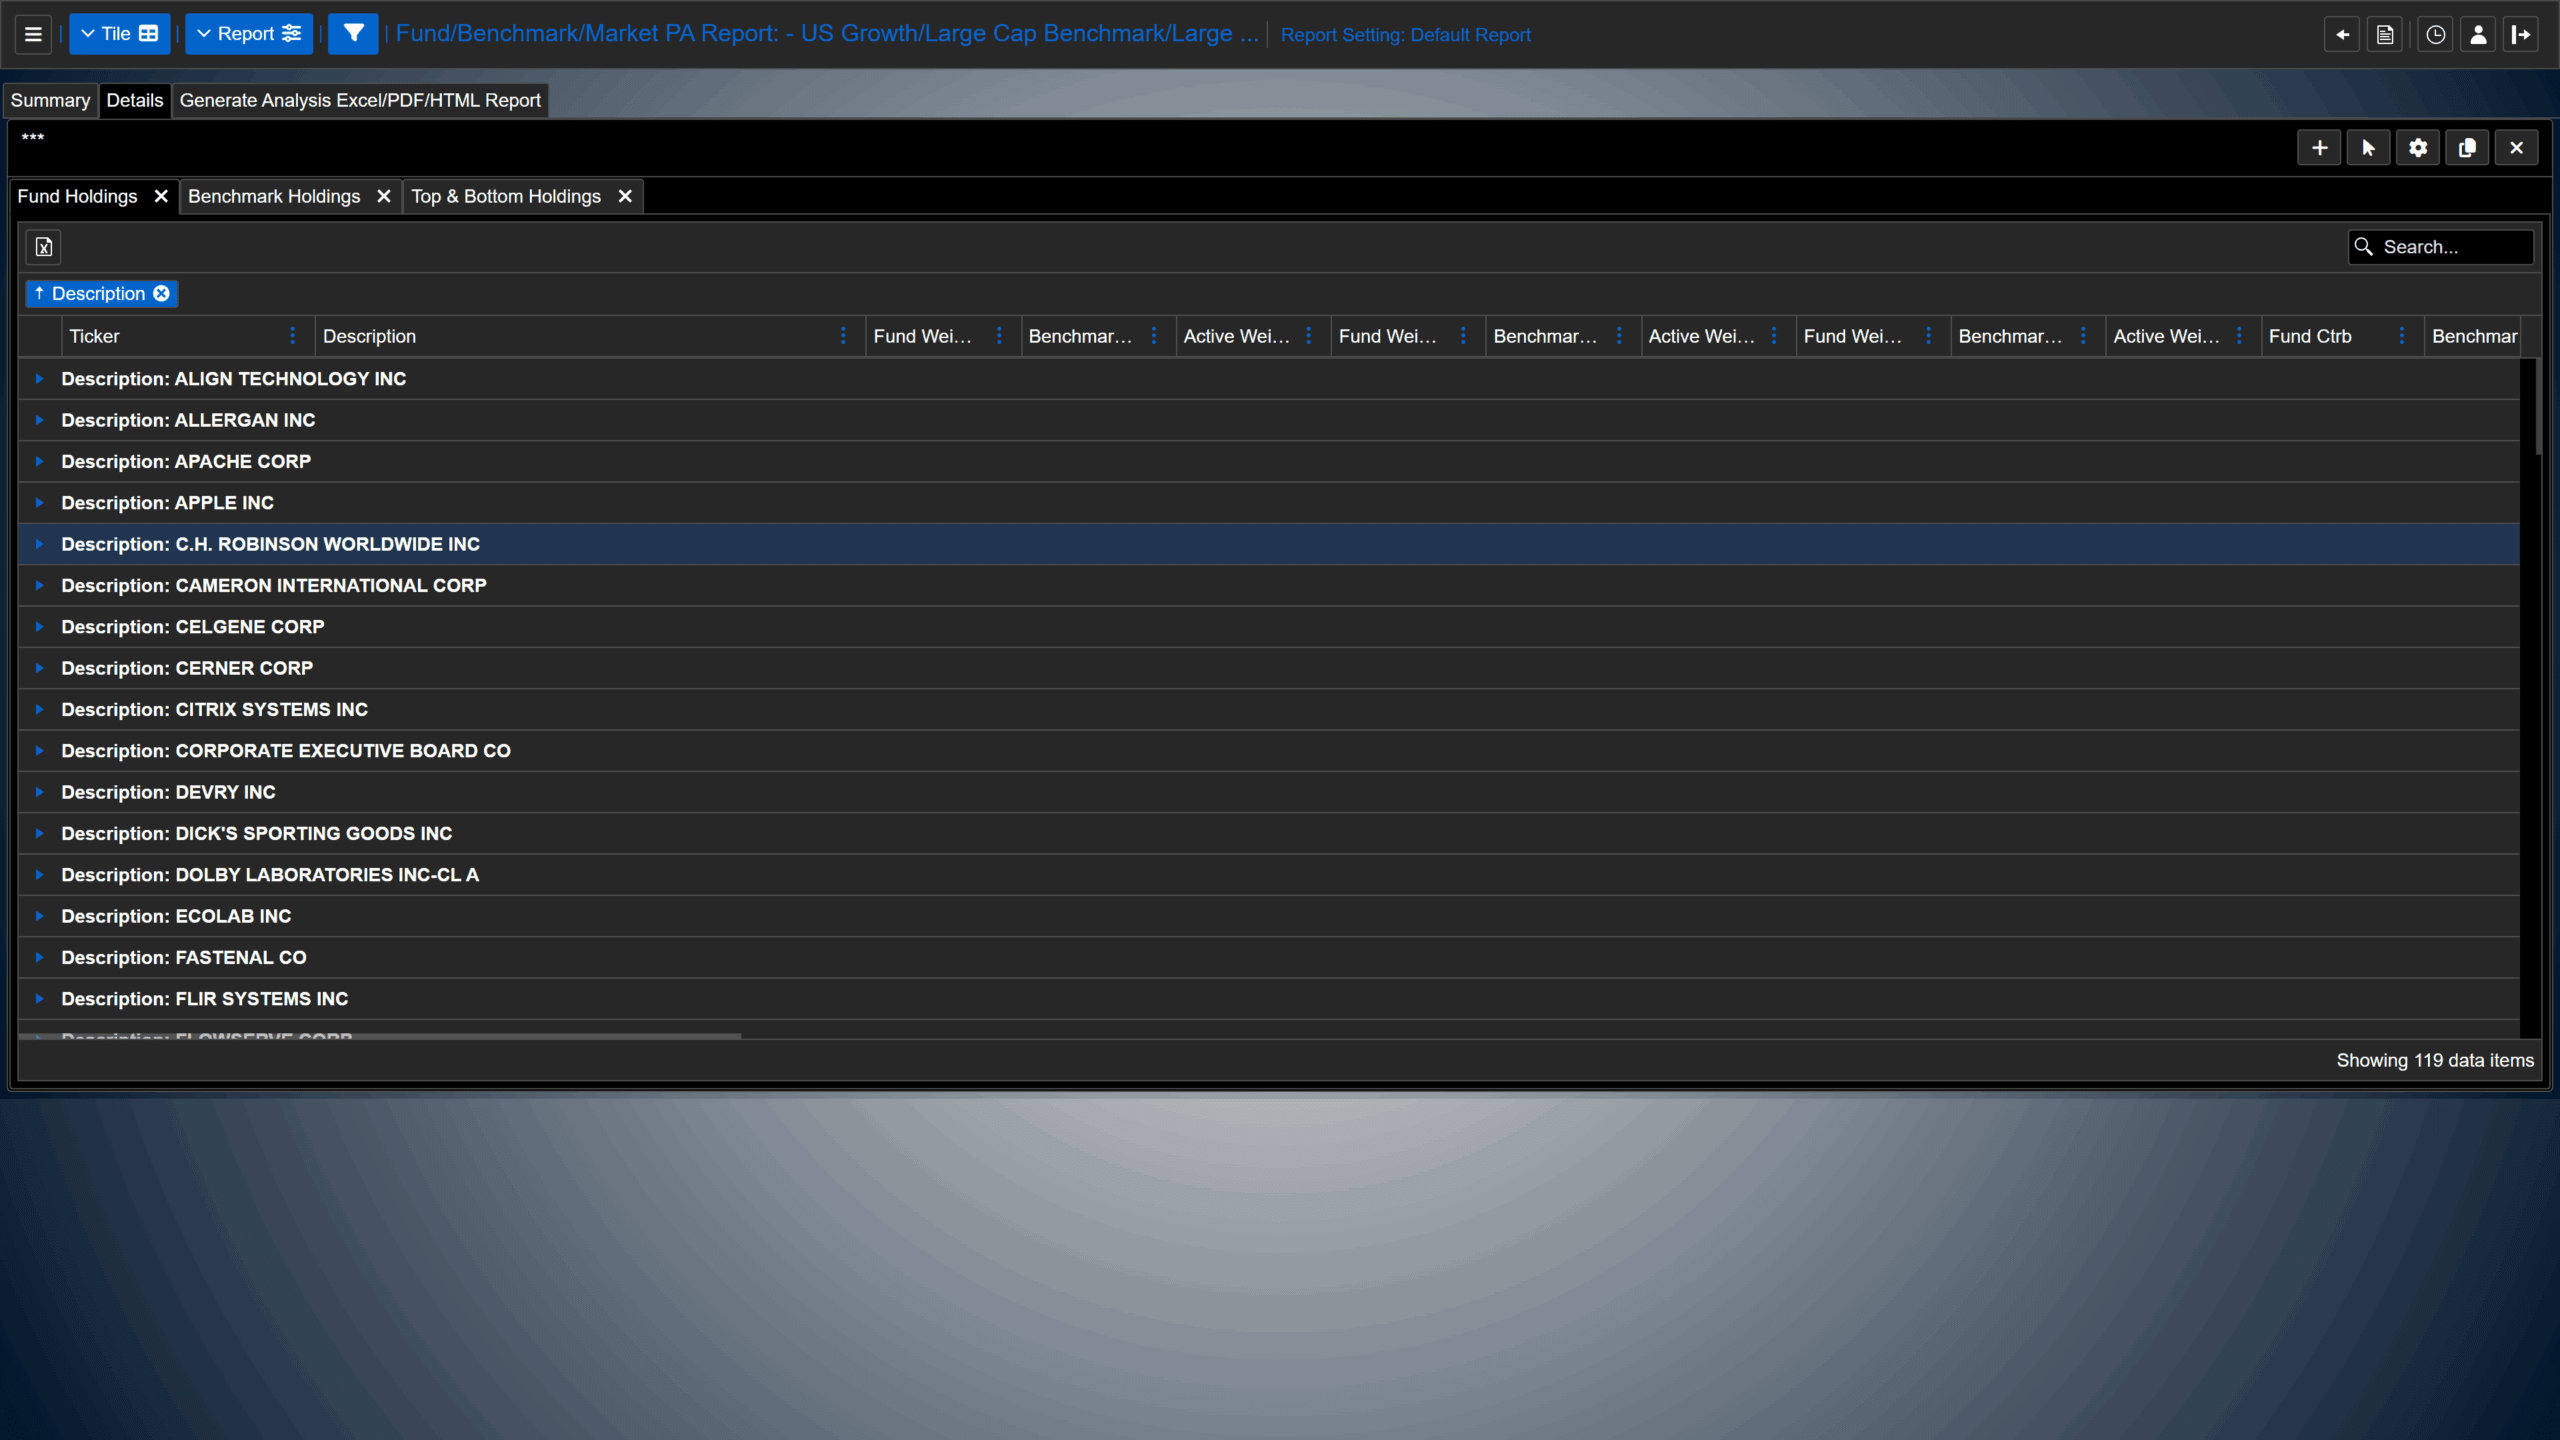
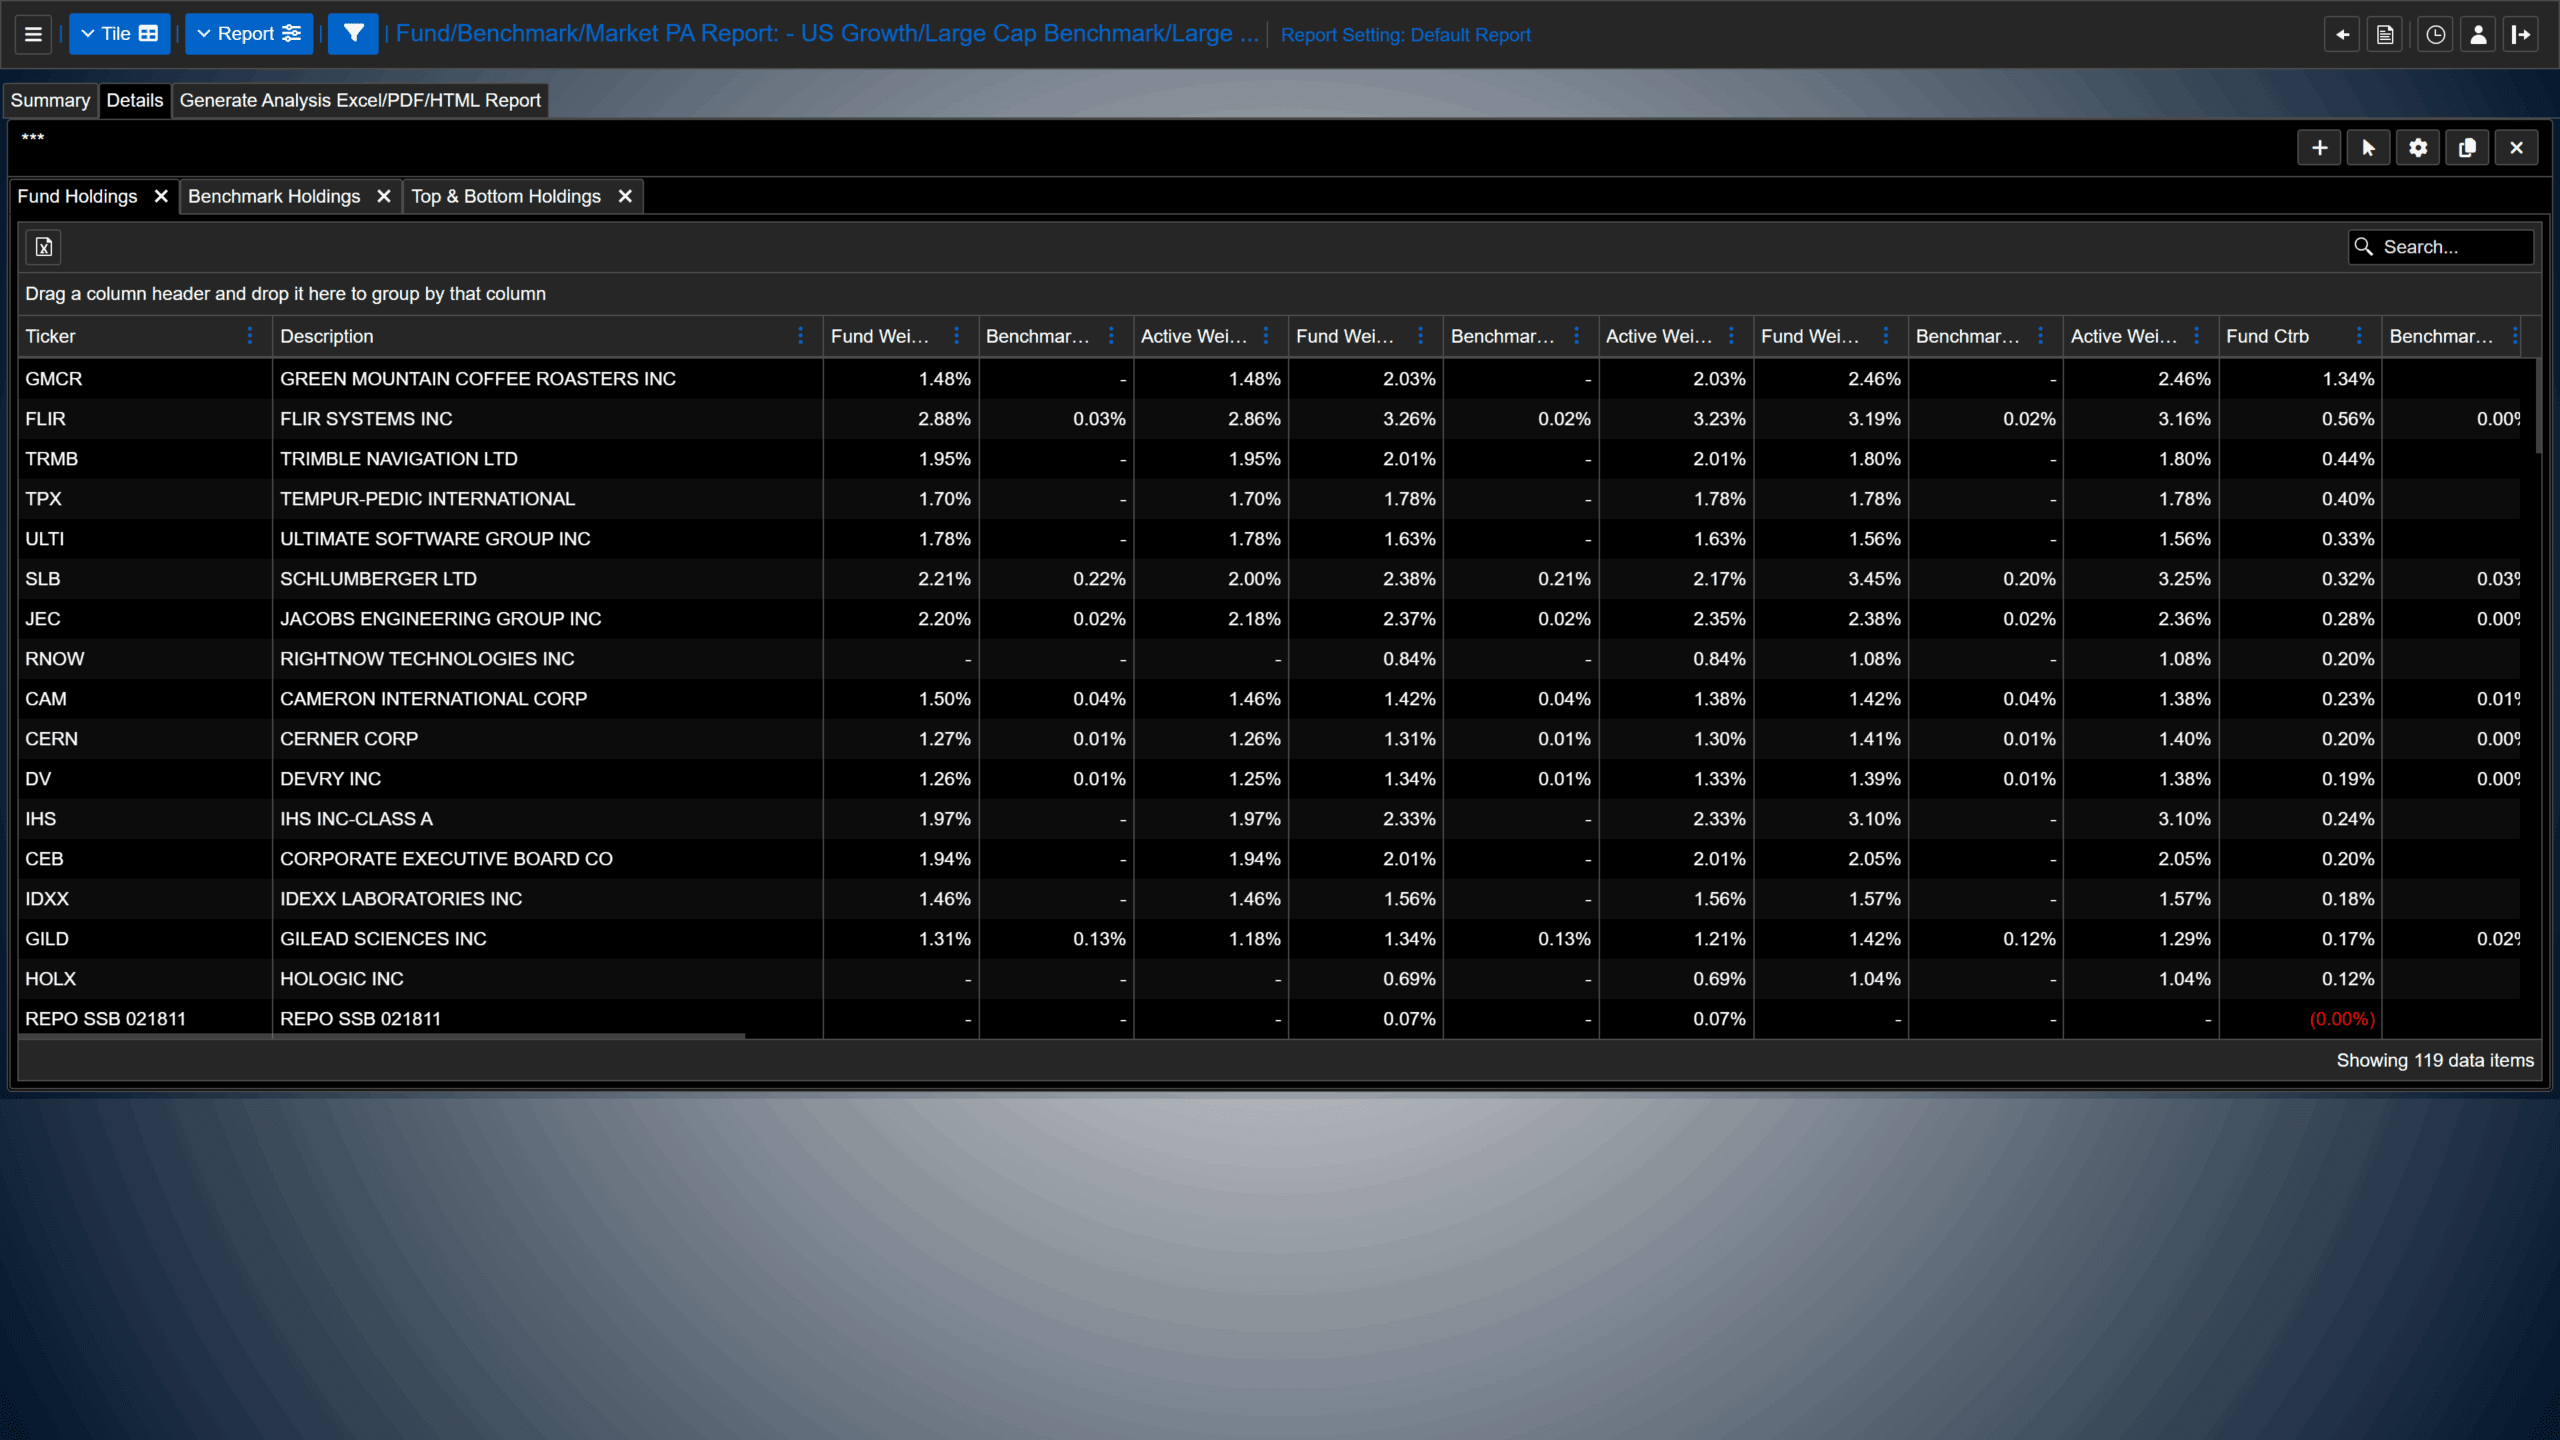
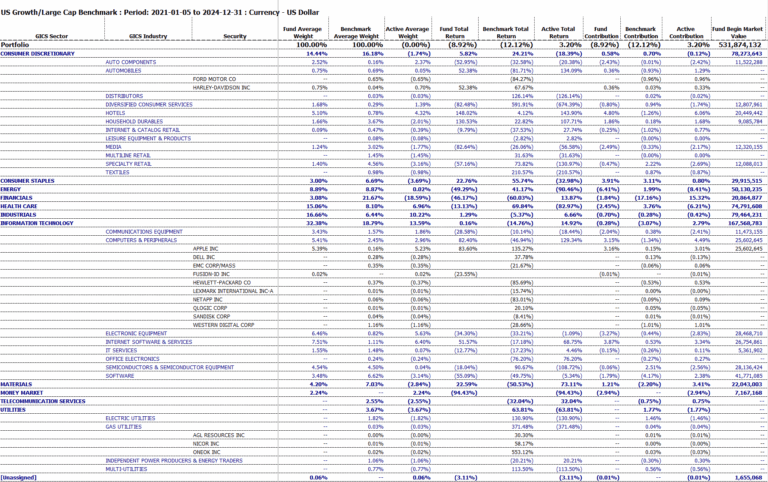
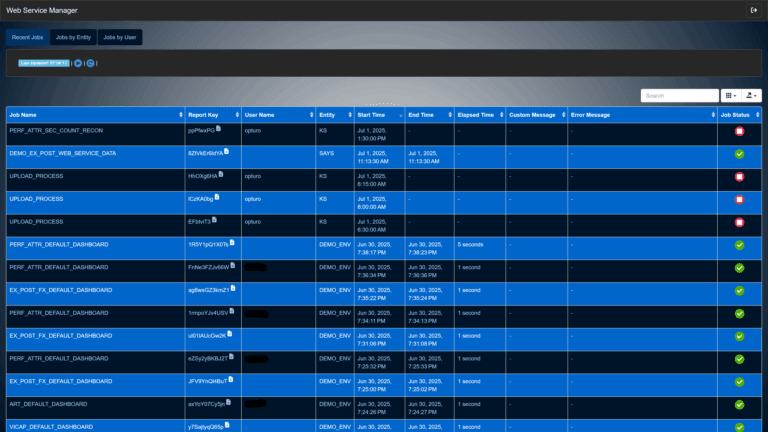
Data can be displayed on multiple pages, and tiles can be created, edited, or resized for each chart type with various customization options. Add multiple tabs to each tile to quickly navigate between charts. Tiles can be grouped, searched, or underlying data exported to Excel.
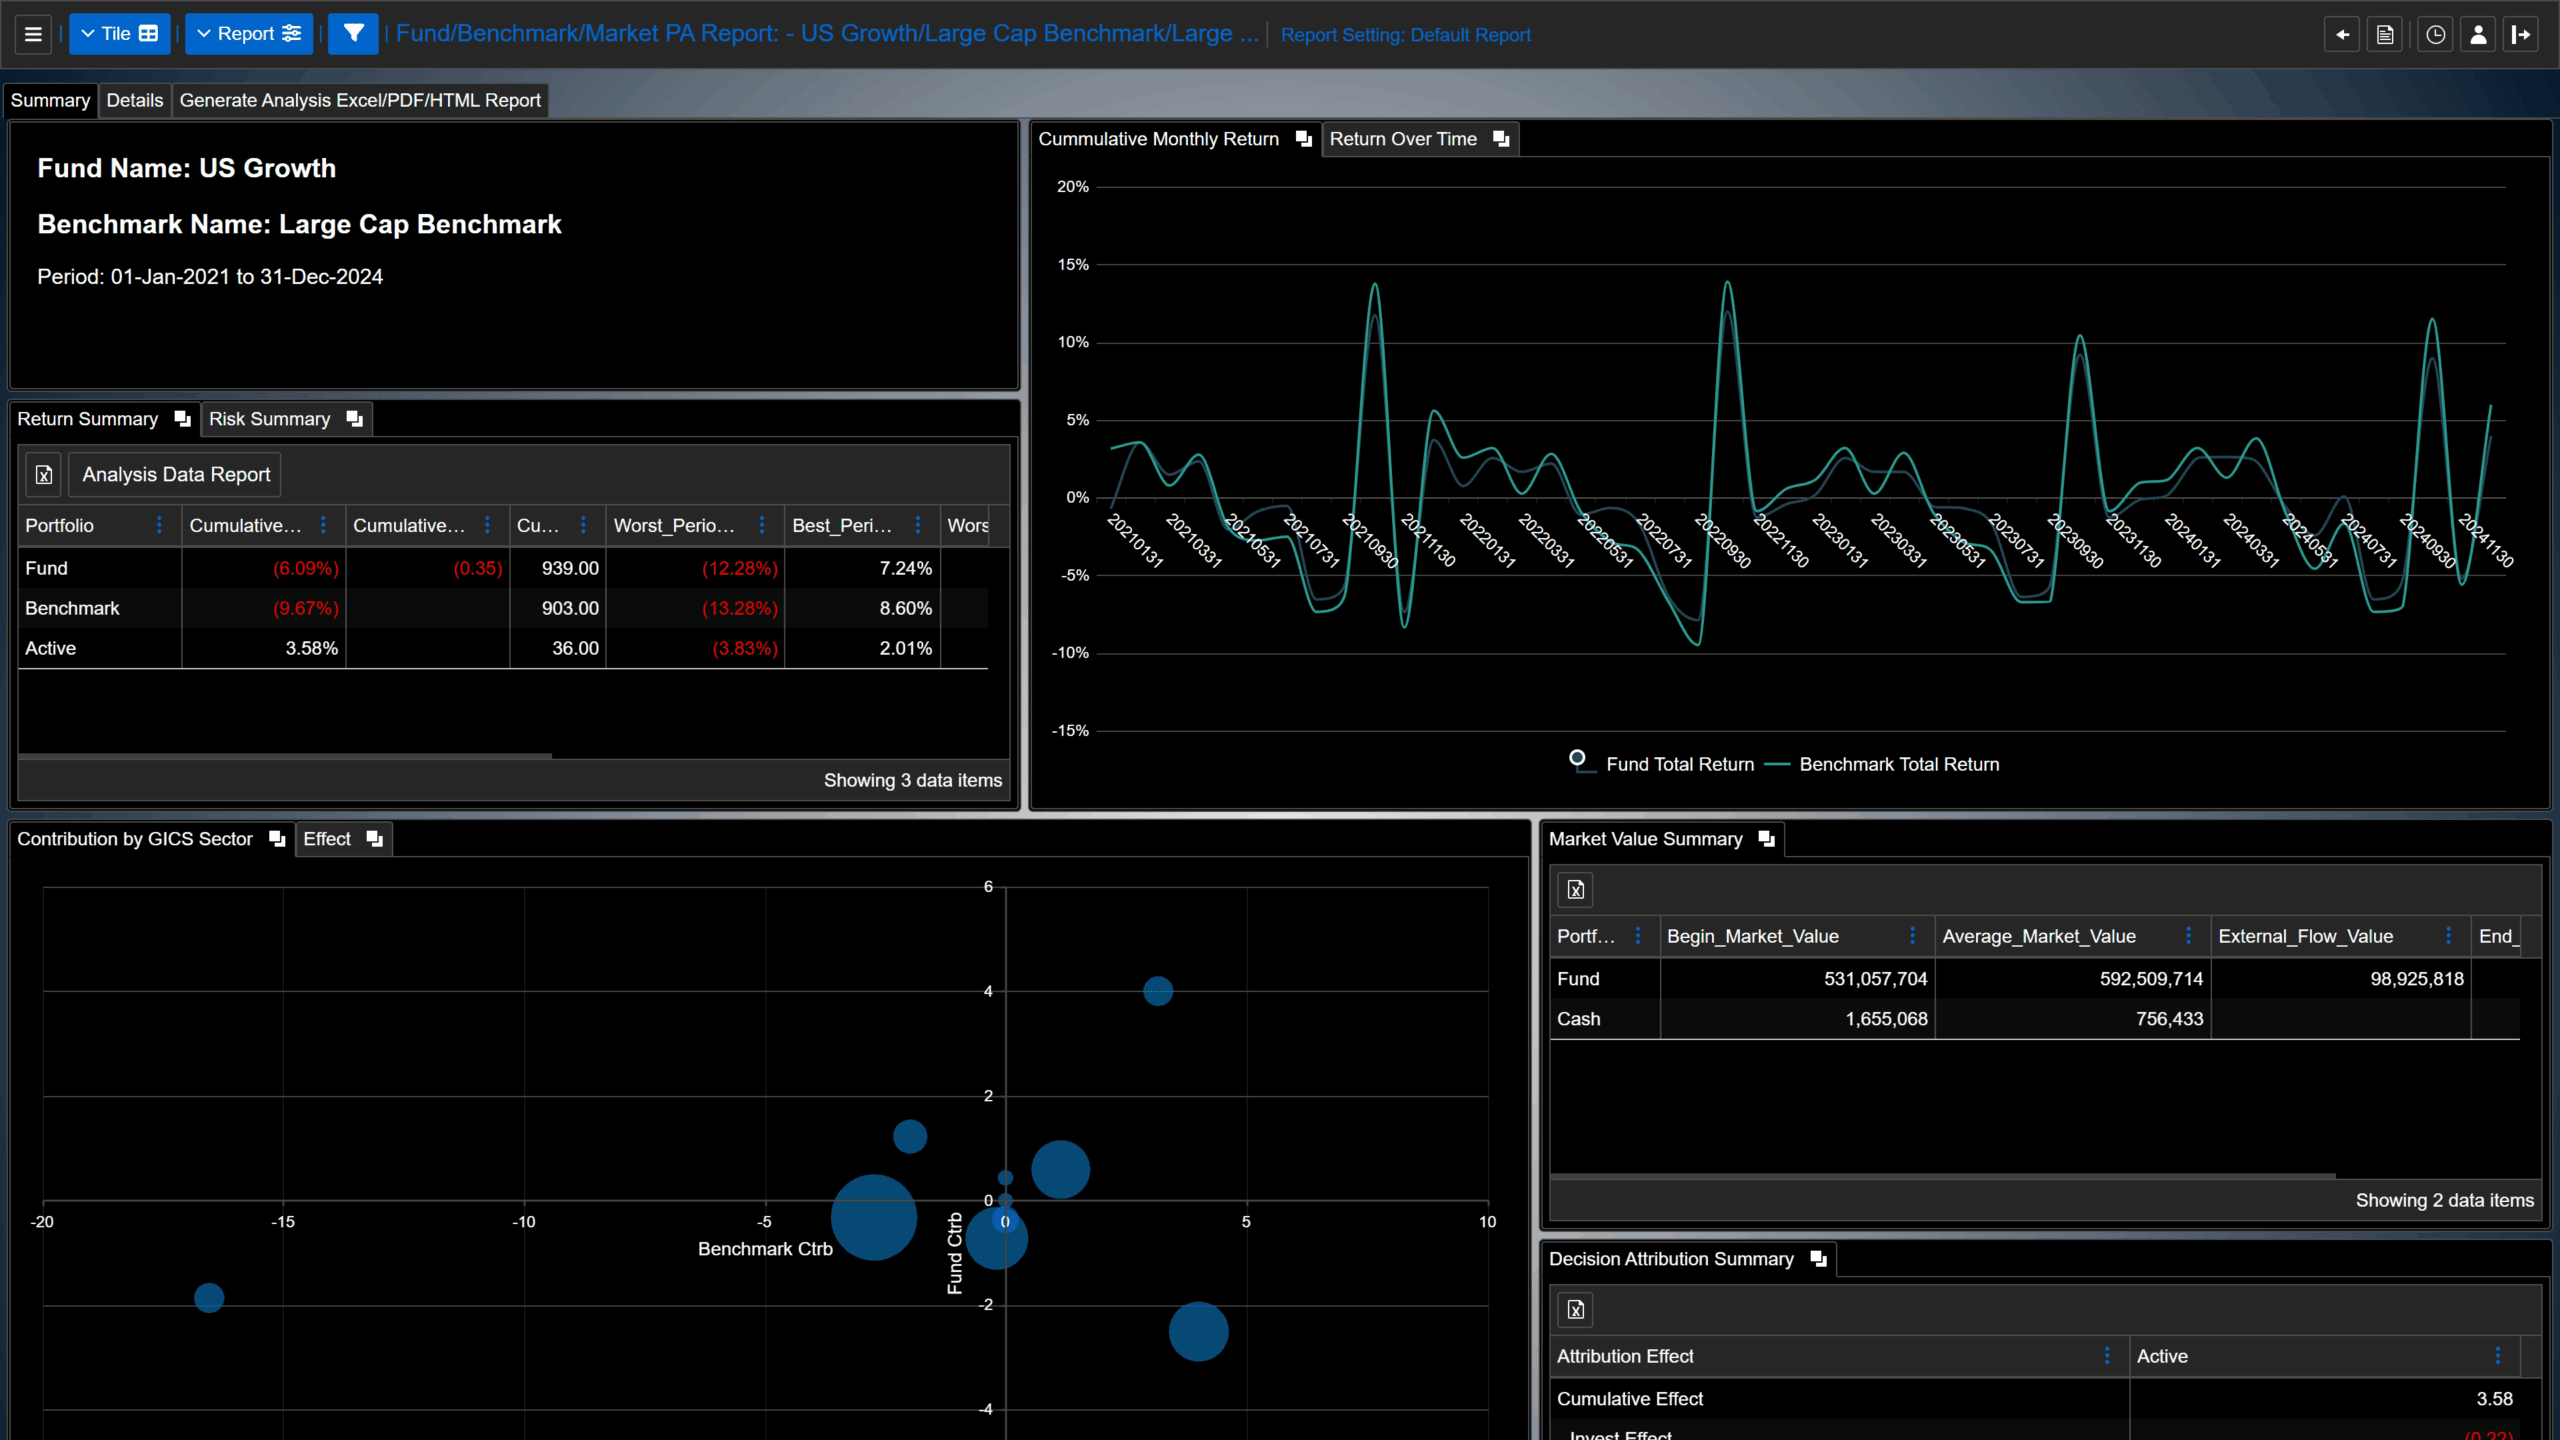
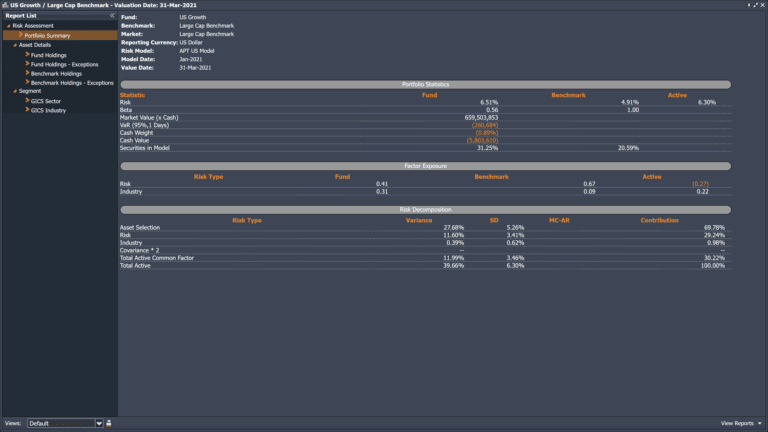
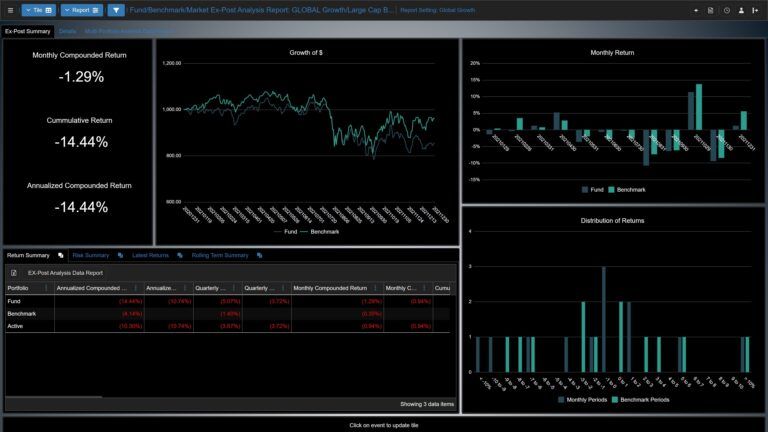
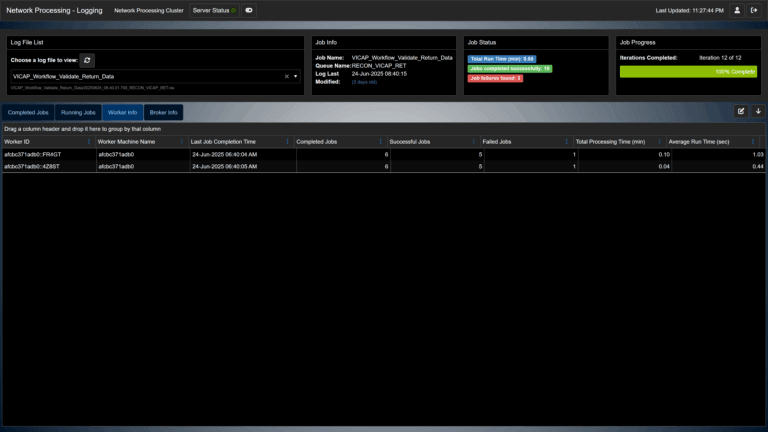
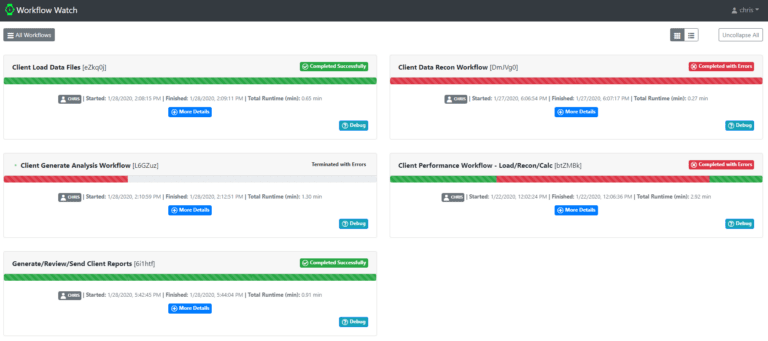
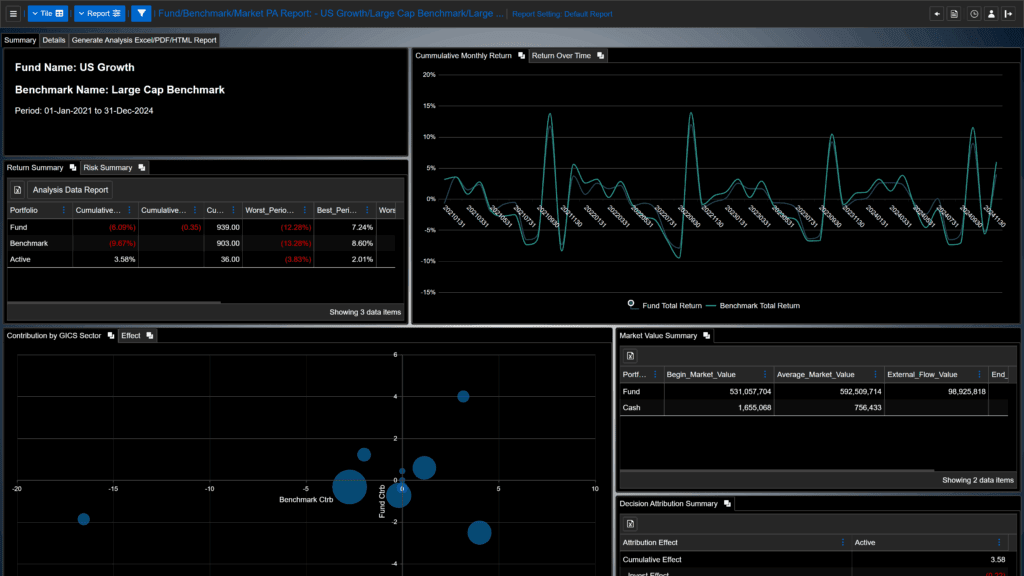
Interactive dashboards
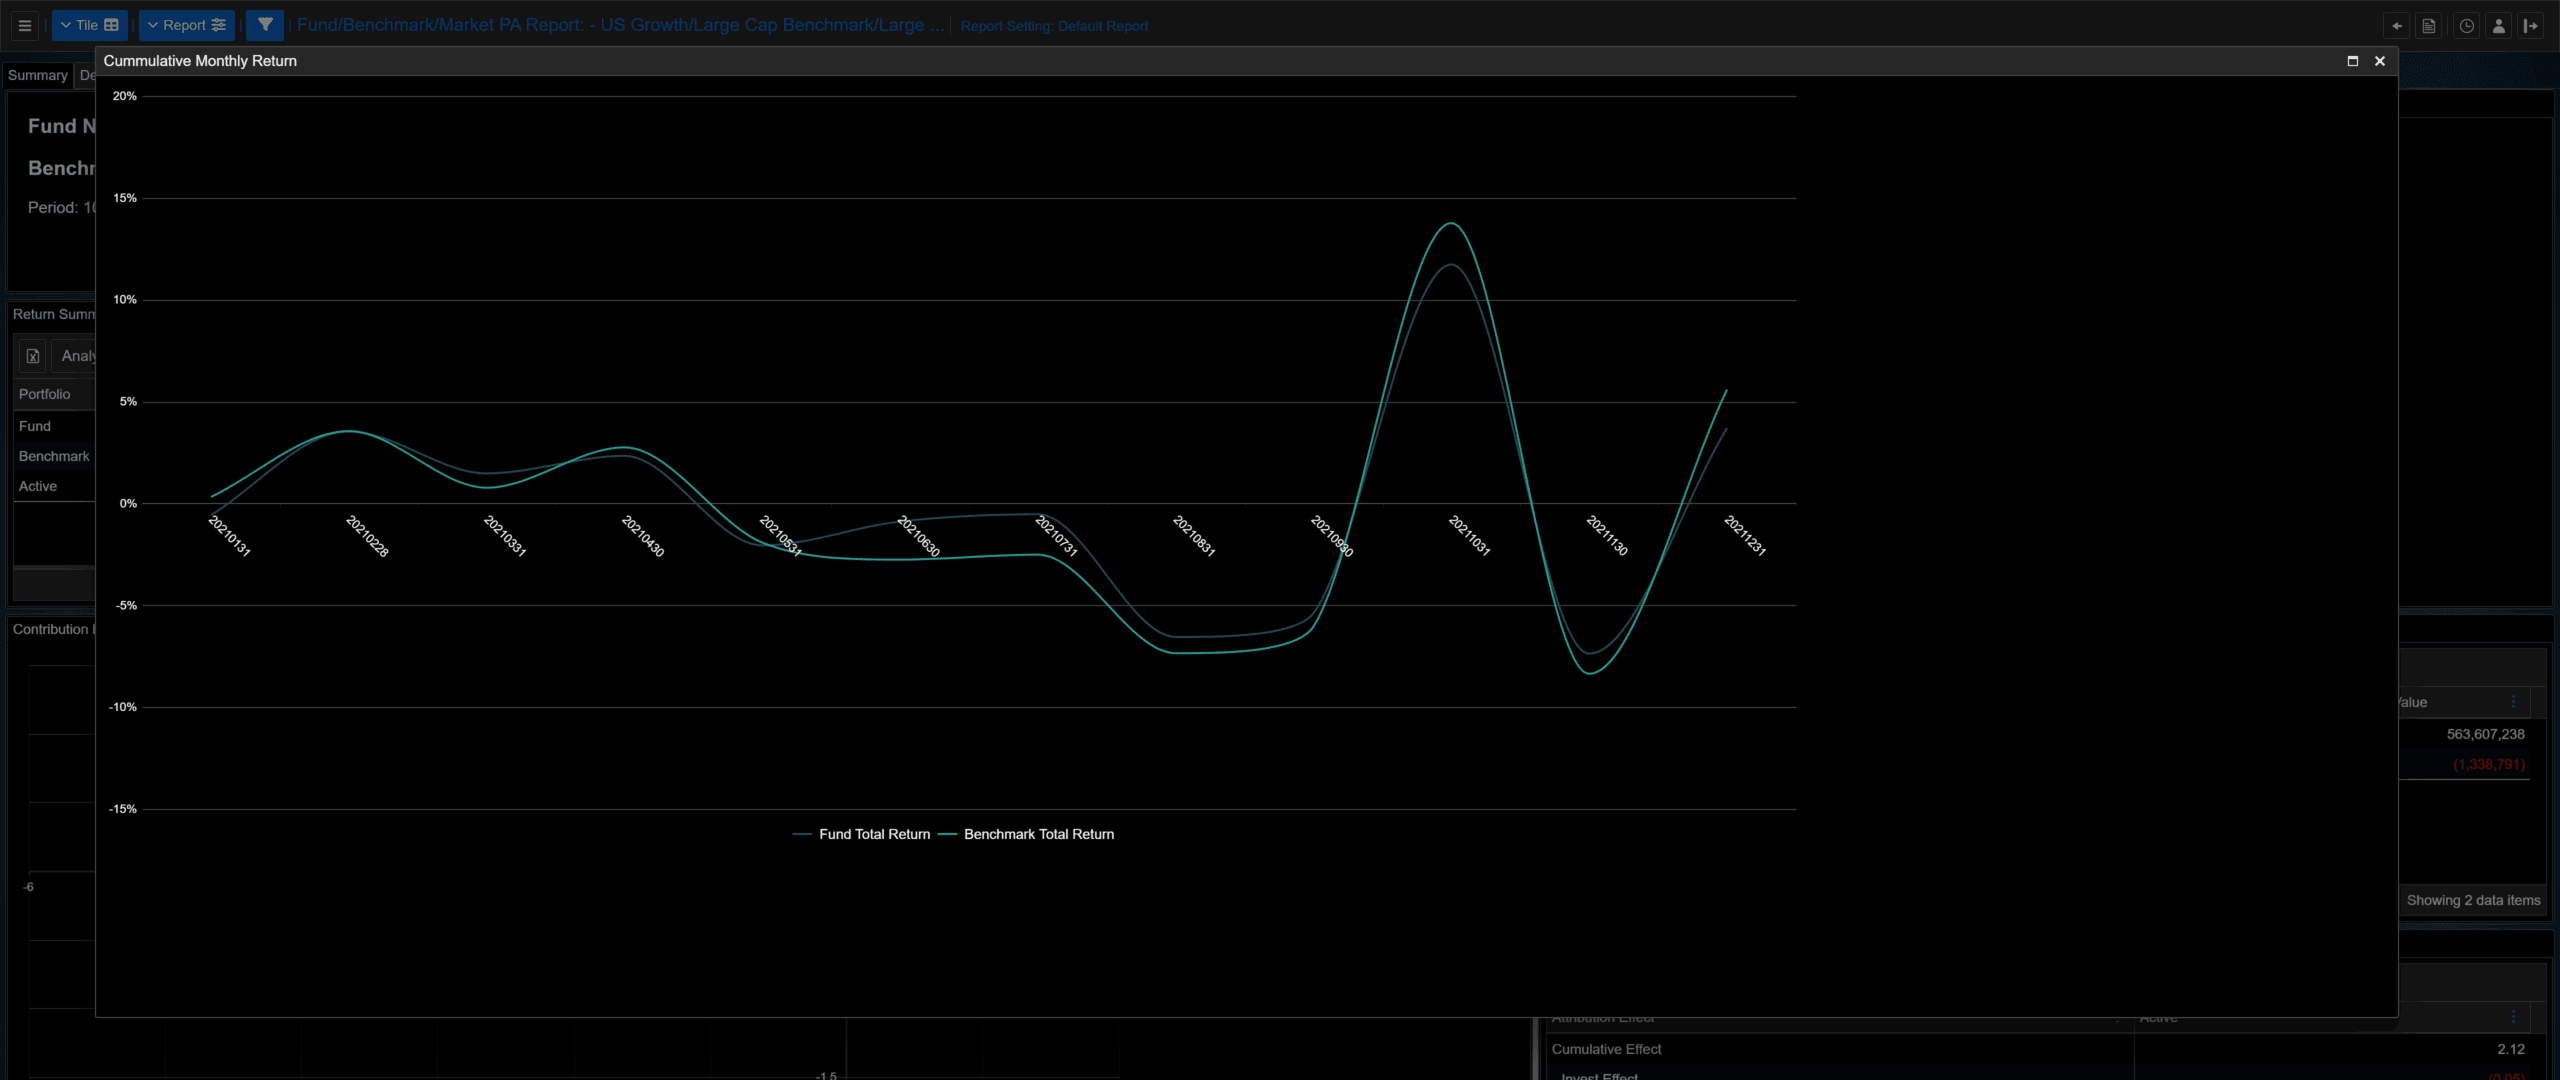
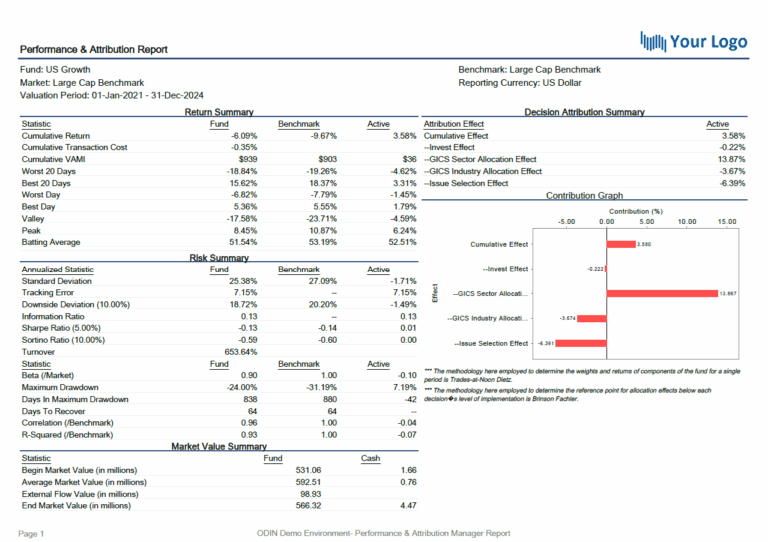
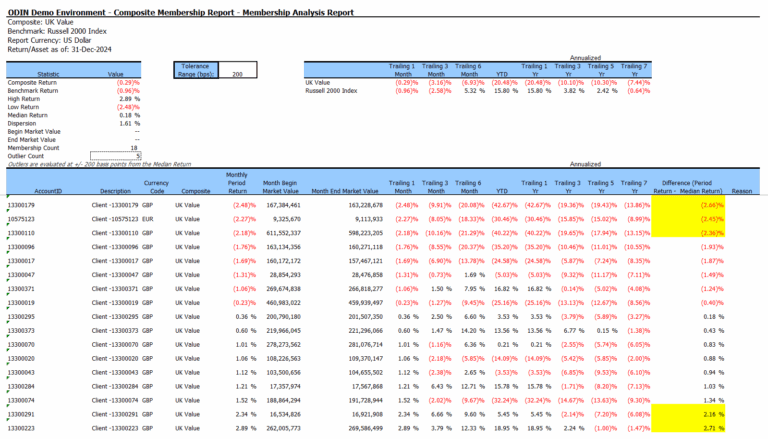
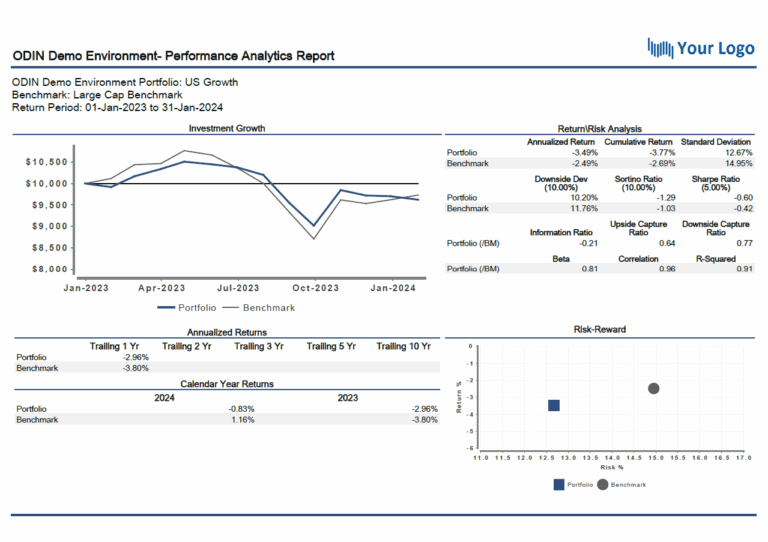
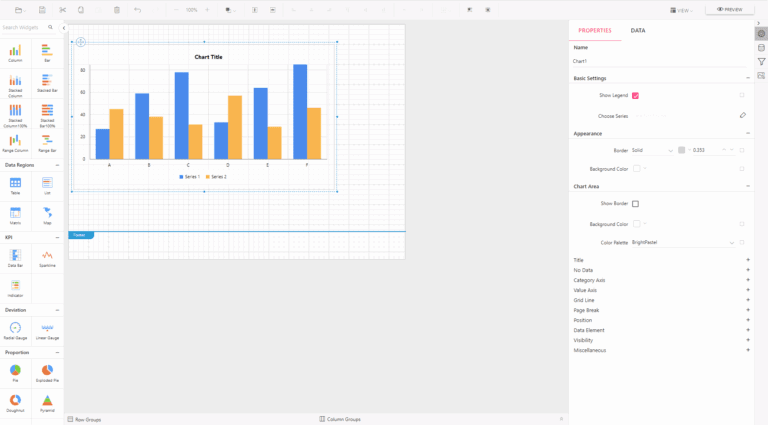
Use item-specific features like multiple grouping, sorting, and tooltips to make the graphs more readable. Graphically represent data in a wide array of charts to present it clearly and concisely, supports commonly used chart types (column, line, shape, area, bar, range, scatter, polar, and more)
Interactive features like “Click Events” open reports or links to other data and create re-usable tile layouts that can be shared with other users.
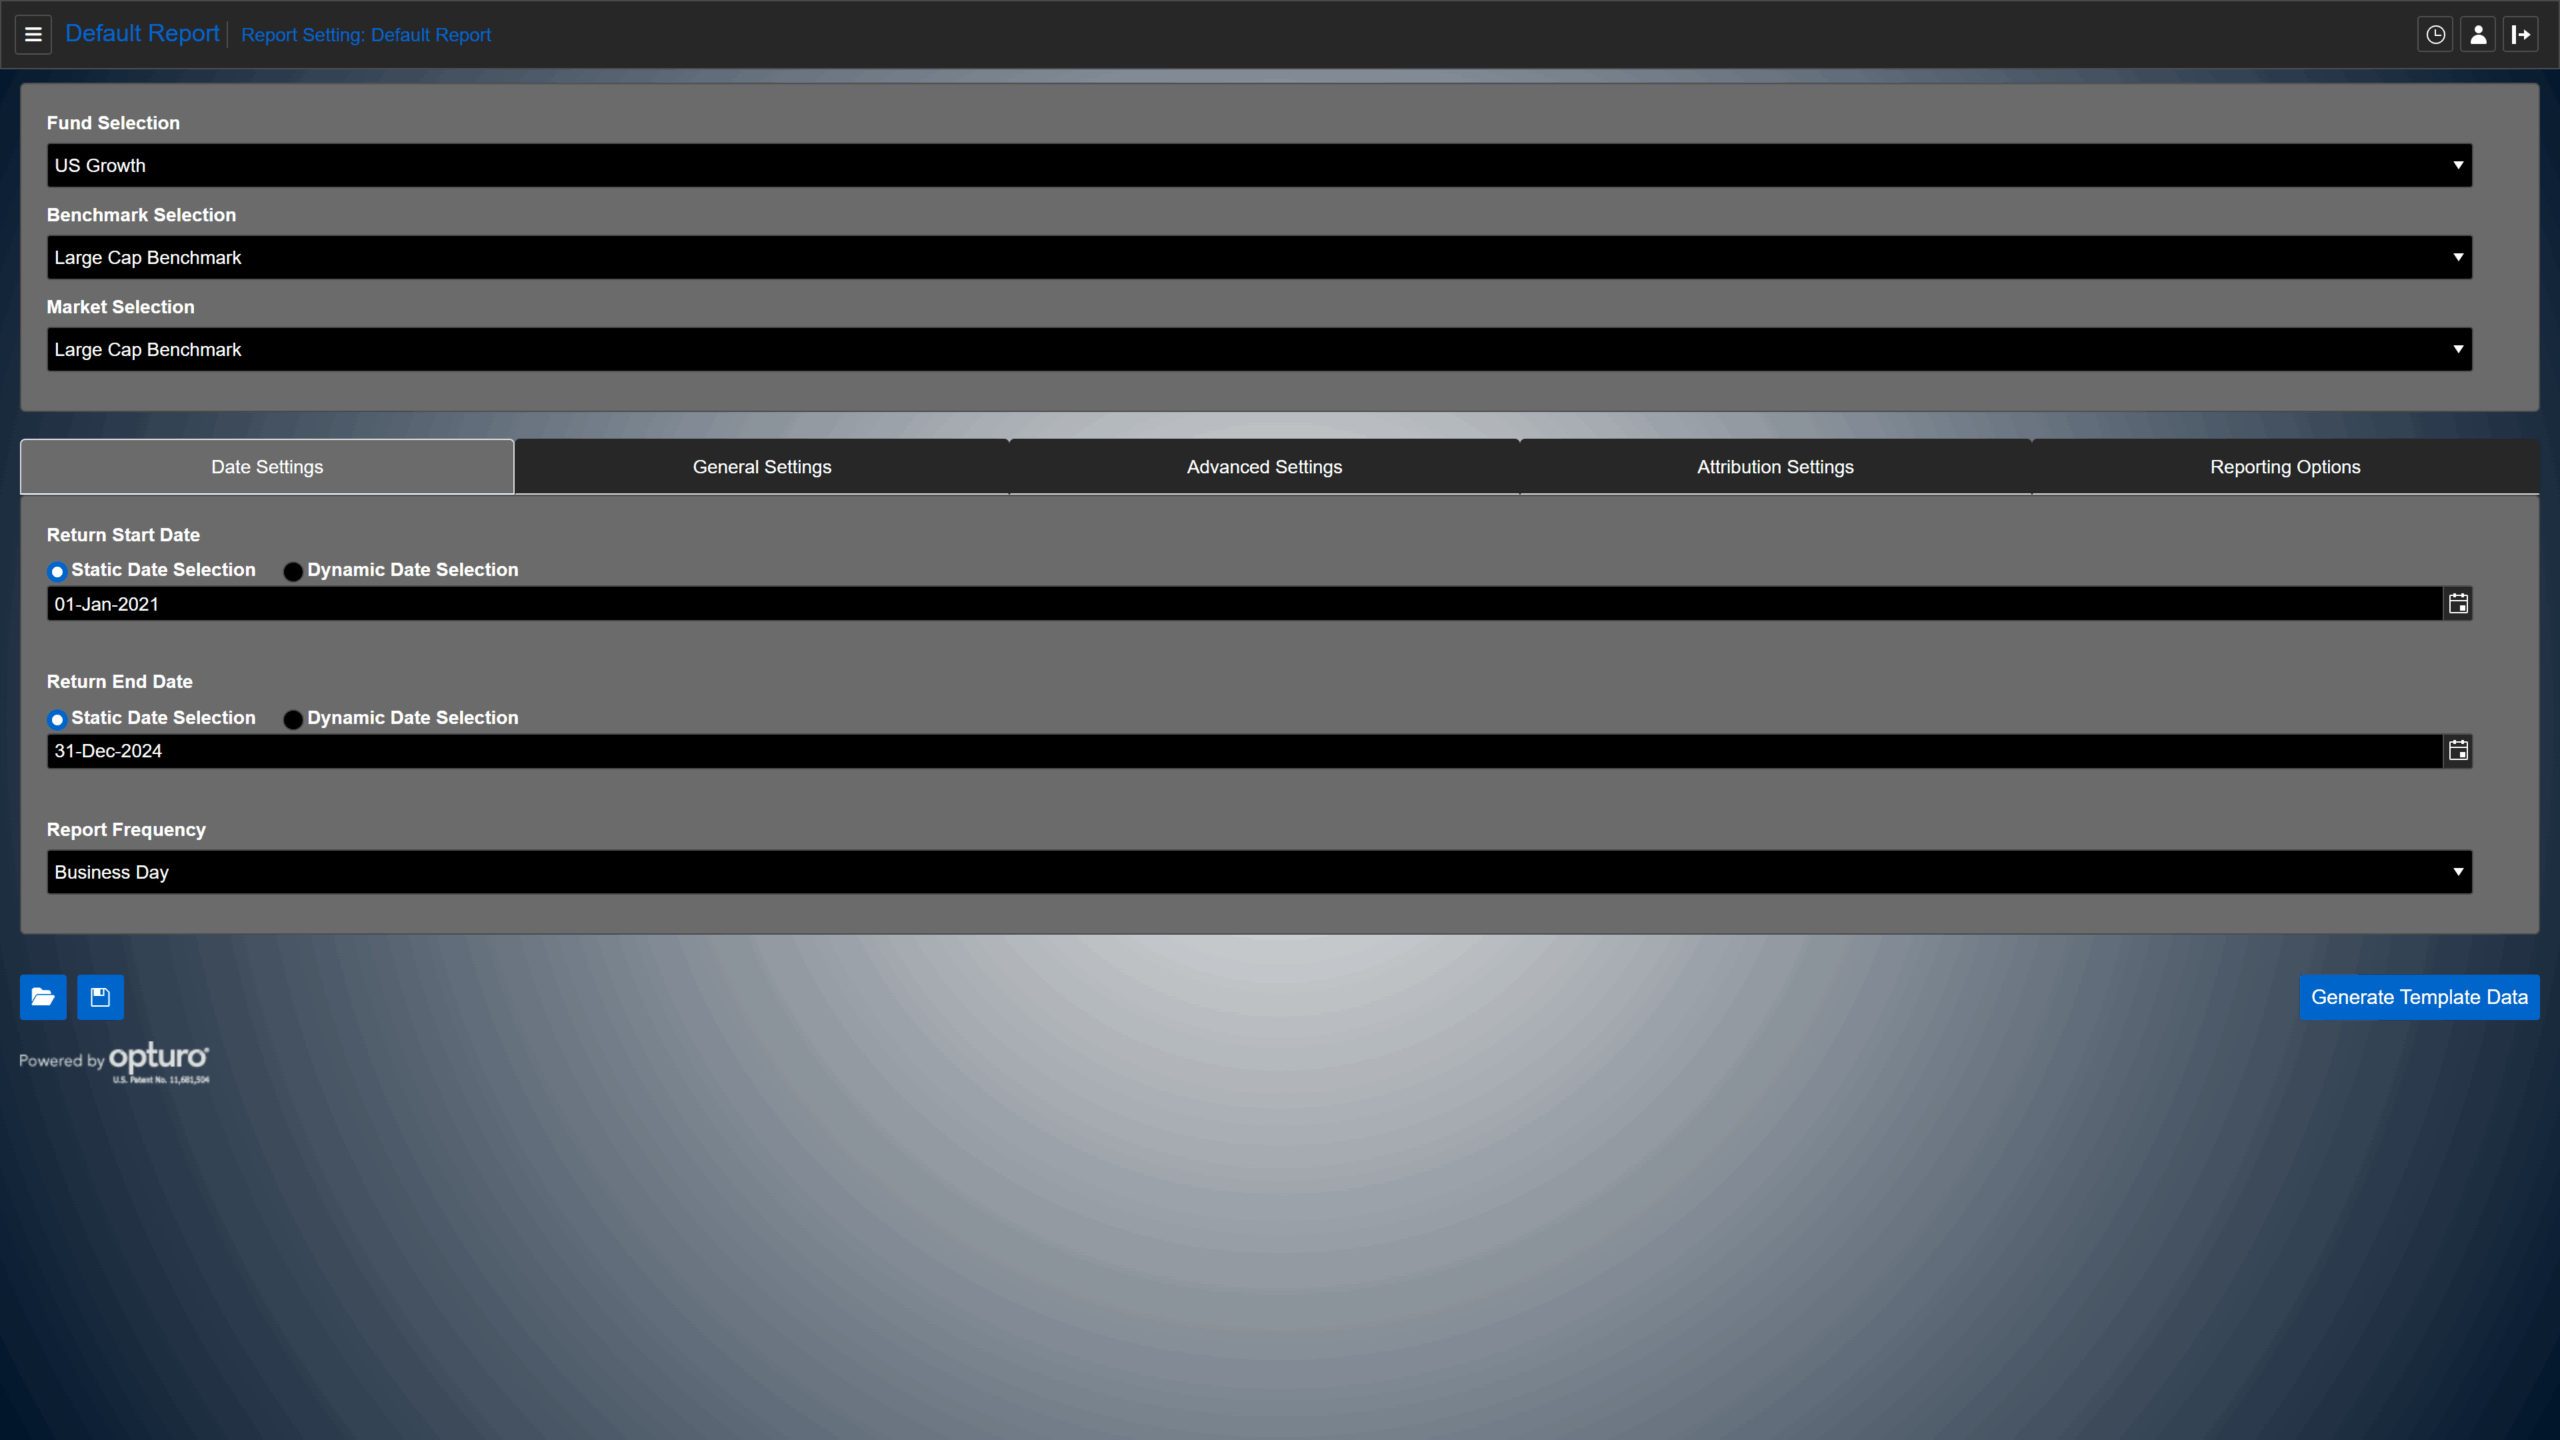
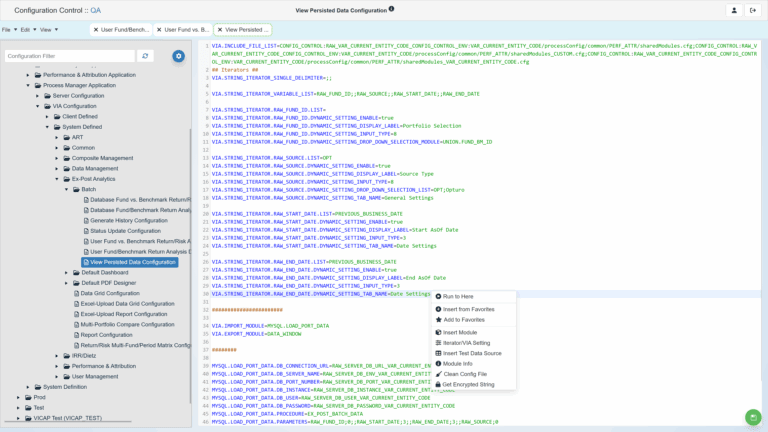
Customization
Dashboards can be customized with custom page styling using CSS or a dashboard theme. It can be easily branded as your own.