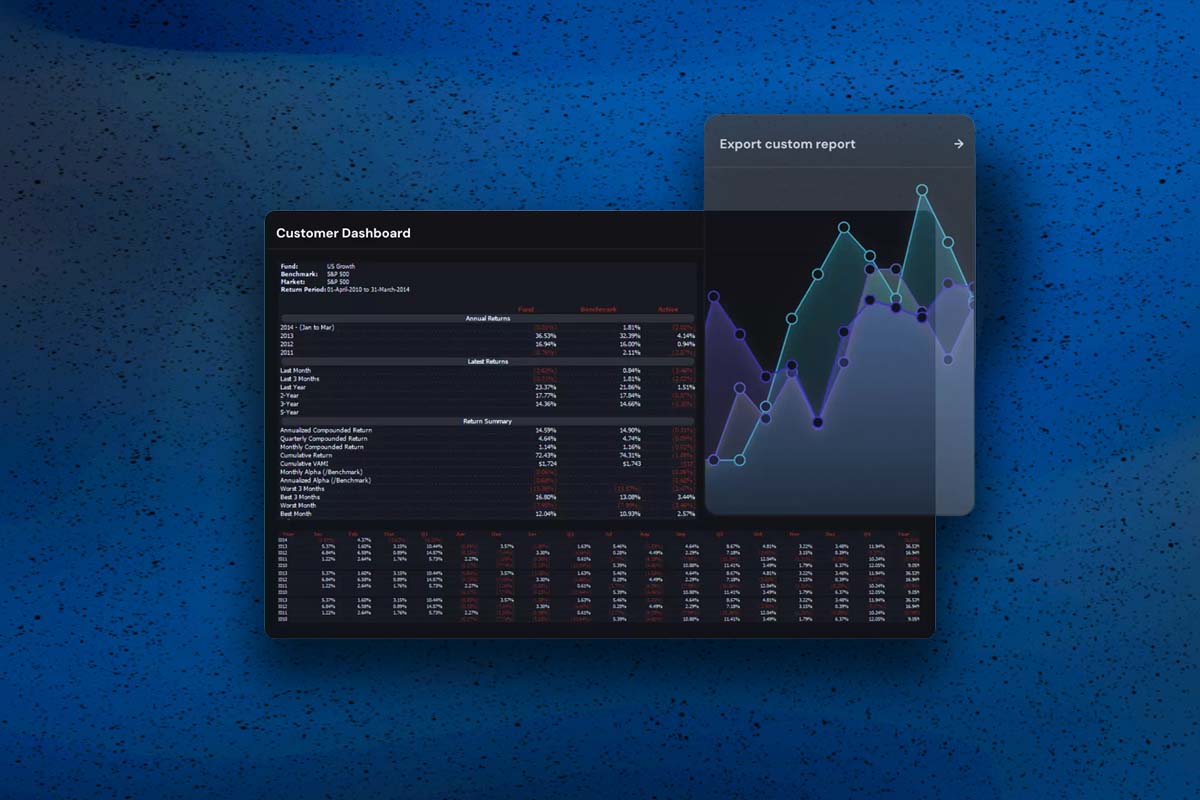
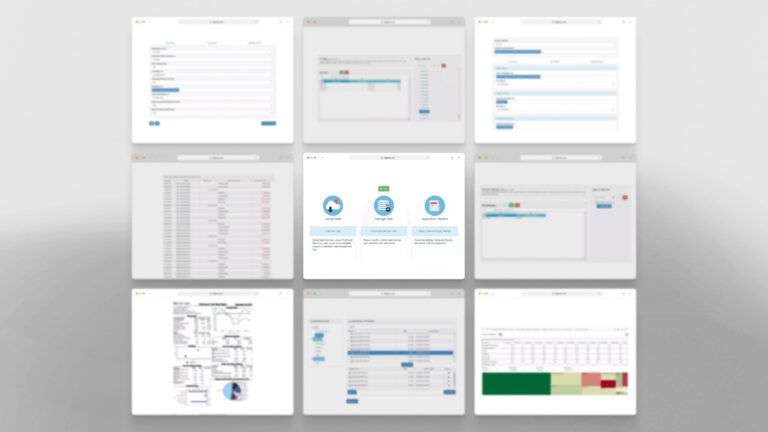
This module is used to output data to the visualization tool, which includes heat maps, line graphs, pie charts, etc. This is a powerful tool to visualize large amounts of data, e.g., returns and market values for hundreds of portfolios over several years.

ODIN Platform
A smarter, bolt-on data management and analytics platform for enterprises. Available on-premises or in the cloud, it works with almost any stack, no overhaul required.

SAYS Platform™
A cloud-hosted data solution that helps small and medium businesses deploy custom apps—fast. Launch smarter analytics tools with a flexible monthly subscription.
 Book Now
Book a free product tour
Schedule a free discovery call with one of our solutions architects to understand all the ways we can save your business time and money.
- About
- Newsroom
- Schedule Demo


