Performance & Asset Reporting Options
Generate Membership
If Generate Membership is checked, the generated report will allow the user to view the membership data of the composite at the account-level for each period. This will be available for viewing in the Membership Data tab.
Return Characteristics
If Return Characteristics is checked, the Summary Data table of the report will display the high, median, and low account return in the composite for each period.
These statistics are calculated one of two ways depending on how the frequency of the input data compares to the reporting frequency.
- If the reporting frequency is the same as the data frequency (for example, monthly account-level returns are provided and the report frequency is monthly), then the high, low and median returns are at the account-level. That is, they will be the highest account-level return, lowest account-level return and median account-level return during each reporting period.
In this case, these statistics tell something about the distribution of account-level returns within the composite.
- If the reporting frequency is not the same as the data frequency (for example, daily account-level returns are provided and the report frequency is monthly), then the high, low and median returns are at the composite-level. That is, they will be the highest single period composite return, lowest single period composite return and median single period composite return during each reporting period. For example, with daily data and a monthly frequency report, the low return column would be the worst single-day composite return during each month.
In this case, these statistics tell something about the distribution of composite-level returns during each period.
% of Non-Fee Assets
If % of Non-Fee Assets is checked, a column will appear in the Summary Data tab that will list the percentage of assets in the composite for each period that did not pay fees.
Total Assets
If Total Assets is checked, two additional composites will appear in the Summary Data table: Percentage of Firm Assets and Total Firm Assets.
-
The Total Firm Assets column intuitively lists the total value of the firms assets, including all accounts for the firm.
-
The Percentage of Firm Assets column lists the percentage of the total firm assets that are in the current composite for each period. The calculation is simply Market Value at end of Period divided by the Total Firm Assets.
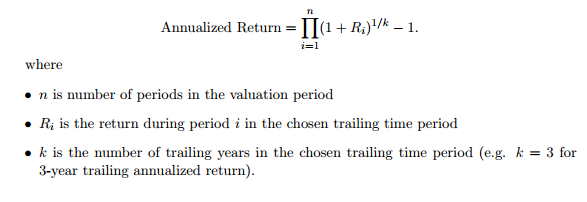
Annualized Returns
If Annualized Returns is checked, the Summary Data table will list the annualized returns for both the composite and the benchmark for the number of rolling years selected.
The annualized return value is computed as follows:
% of Wrap Fee Assets
If $ of Wrap Fee Assets is checked, the Summary Data table will include a column listing the proportion of accounts that have a wrap fee applied to it. Whether or not an account is assigned a wrap fee is defined in the account details.
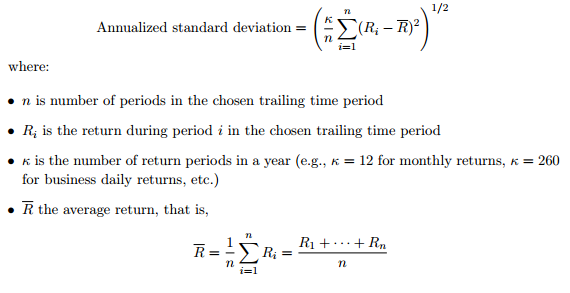
Annualized Standard Deviation
If Annualized Standard Deviation is checked, the Summary Data table will list the annualized standard deviation for both the composite and the benchmark for the number of rolling years selected.
The standard deviation of a return stream is a common measure of the riskiness of an investment. It measures the average "distance" of the returns from the average return over a period (the larger the distance, the riskier the investment). The formula for this is the following:
Account Statistics
If Account Statistics is checked, the Summary Data table will include a column listing the number of accounts in the composite for each period.
Use Override Data
If Use Override Data is selected, ODIN will use the legacy data in the system
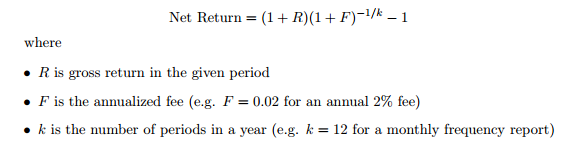
Net of Fees
If Net of Fees is checked, the Summary Data table will include a column displaying the Gross Composite Net Return without fees, allowing the user to view the returns with and without fees side-by-side.
The calculation for Gross Composite Net Return without fees is the following:
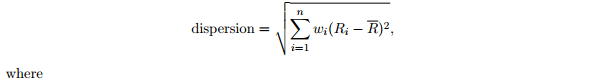
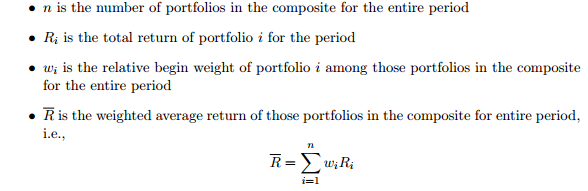
Dispersion
If Dispersion is checked, the Summary Data table will list the dispersion for each period.
Dispersion is a measure of how spread out the account-level returns within the composite were for each period. A larger number is an indication that the accounts within that composite probably do not all share the same strategy.
The dispersion calculation is shown below:
Minimum Account Dispersion
The minimum account dispersion is the number of accounts necessary in the composite for the dispersion statistic to appear in the report if selected. For example, with a minimum account dispersion of 20, only periods where the composite contained 20 or more accounts will display the dispersion.
Use Monthly Data
If user input contains daily data, Use Monthly Data can be selected to create reports based on monthly data instead of daily data.
Rolling Years
The user can choose the number of years to use for annualized return and annualized standard deviation calculations. A rolling year is simply the past 365 days, so if the user selects 3 rolling years, the annualized calculations will the previous 3 years of data from the reference date. For example, the annualized standard deviation for June 30, 2006 will use the composite returns from July 31, 2003 to June 30, 2006 if the number of rolling years is 3.